
The Agency by Agency Atlas 2026 Agencies and the regions
Geography shapes the agency sector in ways that go beyond simple headcounts. Where an agency is based influences its access to talent, clients, investment and growth opportunities, and the regional distribution of those advantages is far from even. This chapter examines the sector across the UK's ITL1 regions, the standard geographic subdivisions used by the Office for National Statistics for statistical analysis.
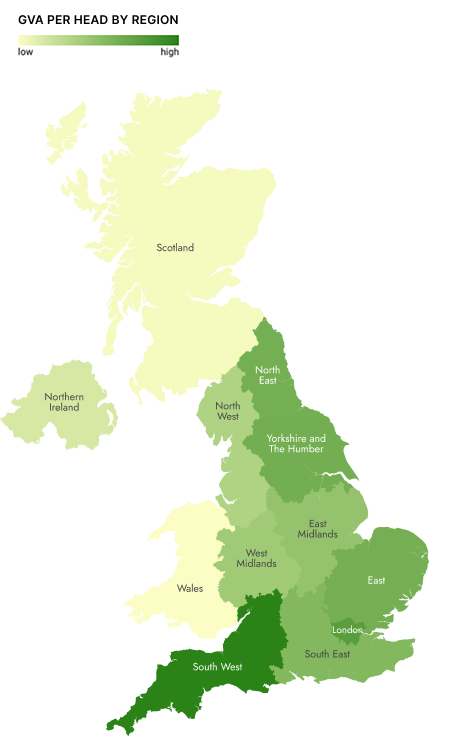
The South West leads the UK
on GVA per head
| GVA per head |
|
|---|---|
| South West | £104k |
| London | £96k |
| All agencies | £94k |
| Yorkshire and the Humber | £90k |
| North East (England) | £90k |
| East (England) | £90k |
| South East (England) | £87k |
| East Midlands | £84k |
| West Midlands | £82k |
| North West (England) | £79k |
| Northern Ireland | £72k |
| Scotland | £67k |
| Wales | £66k |
Because agencies are mapped by operating address, and a single agency may operate from more than one location, individual agencies can appear in more than one region. Regional shares of agency numbers will therefore sum to more than 100%, and workforce and turnover figures have been adjusted so that each agency’s contribution is distributed across its operating locations to allow for regional comparison.
Understanding the regional picture matters not just for those seeking or supplying agency services outside London, but also for those tasked with building a genuinely national creative economy, one of the stated ambitions of the UK’s Industrial Strategy.
London dominates, but the productivity data tells a more complicated story
Just over a third of all agencies (35.6%) are active in London, and the capital accounts for 48.8% of the agency workforce and 63.7% of total sector turnover. London’s average turnover per head of £260,762 is almost 50% higher than the next-placed region, and by almost every conventional measure, London is the dominant force in the agency sector and the gap with the rest of the UK is not narrowing.
At the same time, when we look at GVA per head as a measure of economic value added rather than simply revenue generated, the picture shifts in a way that should give both investors and policy makers pause for thought. Here, London ranks second, not first. The South West leads the UK on GVA per head at £104,276, ahead of London’s £95,515. Yorkshire and the Humber, the North East and the East of England all sit within a relatively narrow band of each other, and all are closer to London’s GVA per head than London’s turnover per head would suggest. The North East, meanwhile, records the highest average growth rate of any region at 4.8%.
The headline story therefore is not simply London’s dominance but the gap between London’s revenue concentration and its value-added performance, especially relative to regions that, on paper, look far less significant. For the Industrial Strategy’s ambition to build creative hubs beyond the capital, this data offers a more encouraging foundation than the turnover figures alone would suggest.
The sector tilts towards the South East, but regional presence is significant
Beyond the agencies operating in London, 17.9% can be found in the South East, making these two neighbouring regions home to the most significant agency community in the UK. The North West (10.2%) and East of England (10.1%) form a second tier, followed by the South West (9.1%), Yorkshire and the Humber (7.0%) and the West Midlands (6.9%).
Beyond England, Scotland accounts for 4.3% of agencies, a meaningful presence for a nation of its size, while Wales (2.4%) and Northern Ireland (1.1%) each represent smaller but active agency communities. The regional spread, while London-dominated, is broader than many accounts of the sector sometimes acknowledge, as more than six in ten agencies operate outside the capital and many of the regions below the top two have developed genuine agency ecosystems of their own.
Agency share by region
About the data
We map the number of agencies in the UK agency sector together with our partners at The Data City, whose sophisticated machine-learning tool allows us to find and categorise active agencies after adjustment for dormant companies and those in liquidation or administration.
Agency location can be presented in a number of different ways.
For regional distribution of agencies we use the United Kingdom’s ITL1 regions. This stands for International Territorial Level, a geocode standard for subdividing the United Kingdom for statistical purposes and is used by the Office for National Statistics (ONS).
Our partners at The Data City provide us with this data for agencies based on registered and operating addresses. If an agency has operating addresses in more than one region, it will be counted more than once.
London’s share of the sector grows with each measure – from agencies to workforce to turnover
The further up the value chain you look, the more London dominates. Its 35.6% share of agencies rises to 48.8% of the workforce and 63.7% of total turnover. This suggests a pattern of concentration that reflects both the size of London agencies and the premium fees they command.
With just under half the agency workforce in London, the regions with the next largest share of agency jobs are the North West (9.8%) and the South East (9.6%). Scotland is interesting in that it is the only region other than London whose share of the agency workforce (4.7%) is larger than its share of agencies operating in the country (4.3%).
Employee share by region
About the data
Data for employees / headcount is provided by our partners at The Data City based on reporting to Companies House. As there can be a lag in reporting, The Data City’s machine-learning platform can make an accurate best estimate. If an agency has less than three years reported data on employee number, no estimate is made and no data is reported.
Agency location can be presented in a number of different ways.
For regional distribution of agencies we use the United Kingdom’s ITL1 regions. This stands for International Territorial Level, a geocode standard for subdividing the United Kingdom for statistical purposes and is used by the Office for National Statistics (ONS).
Our partners at The Data City provide us with this data for agencies based on registered and operating addresses. If an agency has operating addresses in more than one region, it will be counted more than once.
London’s dominance of turnover, with almost two thirds of the sector total (63.7%) points to the fact that the capital is not only home to larger agencies but ones that operate in high-turnover sectors. Outside of London, regions such as the East of England (10.1% of agencies, 4.2% of total workforce and 2.8% of total turnover) indicates a concentration of smaller or lower-revenue agencies. The gap between agency count and turnover share is widest for the East, East Midlands and Wales, pointing to structural differences in agency scale and specialism across regions.
Turnover share by region
About the data
Data for turnover is provided by our partners at The Data City based on financial reporting to Companies House. As there can be a lag in financial reporting, The Data City uses sophisticated modelling to provide estimated turnover for the current year’s values. Where this is impossible, no data is reported.
Naturally, turnover should be treated carefully. Some types of agency, such as media, are more likely to include media billings and other campaign costs in the turnover figure they submit at Companies House. Our roadmap includes the development of benchmarking metrics to overcome this including revenue per head, gross profit and net asset value.
Agency location can be presented in a number of different ways.
For regional distribution of agencies we use the United Kingdom’s ITL1 regions. This stands for International Territorial Level, a geocode standard for subdividing the United Kingdom for statistical purposes and is used by the Office for National Statistics (ONS).
Our partners at The Data City provide us with this data for agencies based on registered and operating addresses. If an agency has operating addresses in more than one region, it will be counted more than once.
GVA in the regions: London leads in volume but not efficiency
London’s total GVA of £8.5bn dwarfs every other region: the South West (£2.2bn), South East (£2.1bn) and North West (£2.0bn) are its nearest competitors, each generating roughly a quarter of London’s total. Scotland (£1.3bn) and Yorkshire and the Humber (£1.3bn) contribute meaningfully, while Wales (£357m), Northern Ireland (£314m) and the North East (£472m) represent the smallest regional GVA pools.
Best estimate total GVA share by region
About the data
GVA stands for ‘Gross Value Added’ and our GVA data is provided by our partners at The Data City and is estimated at the company level using official GVA (as defined by ONS) and employment data.
Agency location can be presented in a number of different ways.
For regional distribution of agencies we use the United Kingdom’s ITL1 regions. This stands for International Territorial Level, a geocode standard for subdividing the United Kingdom for statistical purposes and is used by the Office for National Statistics (ONS).
Our partners at The Data City provide us with this data for agencies based on registered and operating addresses. If an agency has operating addresses in more than one region, it will be counted more than once.
When we look at GVA per head, however, the figures reveal a different hierarchy. The South West leads at £104,276, ahead of London (£95,515), Yorkshire and the Humber (£90,143) and the North East (£89,973). Scotland (£67,122) and Wales (£66,045) sit at the bottom of the GVA per head table, suggesting that despite reasonable agency numbers, the value being generated per employee in those nations remains below the national average.
Estimated GVA per employee by region
About the data
GVA stands for ‘Gross Value Added’ and our GVA data is provided by our partners at The Data City and is estimated at the company level using official GVA (as defined by ONS) and employment data.
GVA-per-head is calculated based on the estimated GVA at company level and the number of employees / headcount, as provided by our partners at The Data City based on reporting to Companies House. As there can be a lag in reporting, The Data City’s machine-learning platform can make an accurate best estimate. If an agency has less than three years reported data on employee number, no estimate is made and no data is reported.
Agency location can be presented in a number of different ways.
For regional distribution of agencies we use the United Kingdom’s ITL1 regions. This stands for International Territorial Level, a geocode standard for subdividing the United Kingdom for statistical purposes and is used by the Office for National Statistics (ONS).
Our partners at The Data City provide us with this data for agencies based on registered and operating addresses. If an agency has operating addresses in more than one region, it will be counted more than once.
Where growth is happening: The North is moving
Average growth rates by region range from 4.8% in the North East to 2.5% in the East of England and West Midlands. London (4.6%) and the North West (4.4%) round out the top three, while the South East (2.7%), despite its size, sits in the lower half of the regional growth table. Other regions that outperform the national average of 3.5% are Northern Ireland (3.9%), Scotland (3.9%), Yorkshire and The Humber (3.9%) and East Midlands (3.7%).
Average growth per year by region
About the data
Growth rates are provided by our partners at The Data City and are based on the annual headcount growth of any given agency we have mapped. Headcount growth is based on employee count data and turnover data, and to account for the lag in reporting, The Data City’s machine-learning platform can make an accurate best estimate. If an agency has less than three years reported data on employee number, no estimate is made and no growth data is reported. Growth rates for any given cohort or list of agencies is based on the growth rates of active agencies only.
Agency location can be presented in a number of different ways.
For regional distribution of agencies we use the United Kingdom’s ITL1 regions. This stands for International Territorial Level, a geocode standard for subdividing the United Kingdom for statistical purposes and is used by the Office for National Statistics (ONS).
Our partners at The Data City provide us with this data for agencies based on registered and operating addresses. If an agency has operating addresses in more than one region, it will be counted more than once.
The growth traffic light adds further nuance to these growth figures. London has the highest proportion of fast-growing agencies (12.8%) alongside a meaningful proportion shrinking fast (3.4%), suggesting a more polarised distribution than regions with lower average rates but less extreme tails.
The North East is notable for combining the highest average growth rate with the largest fast-growing cohort (13.4%), though also the highest proportion of agencies shrinking fast (5.3%), indicating a genuinely dynamic but volatile regional market. The South East and East of England, by contrast, show high stability but low growth, suggesting mature, settled markets rather than expanding ones.
Growth rates by region
About the data
Growth rates are provided by our partners at The Data City and are based on the annual headcount growth of any given agency we have mapped. Headcount growth is based on employee count data and turnover data, and to account for the lag in reporting, The Data City’s machine-learning platform can make an accurate best estimate. If an agency has less than three years reported data on employee number, no estimate is made and no growth data is reported. Growth rates for any given cohort or list of agencies is based on the growth rates of active agencies only.
Our ‘Growth Traffic Light’ breaks down the percentage of agencies in any given group that land in one of five growth rate categories: Shrinking fast (below -20% annual growth), Shrinking (-20% to -10% annual growth), Stable (-10% to 10% annual growth), Growing (10% to 20% annual growth) and Growing Fast (over 20% annual growth). If part of the chart is empty, this means that there were no agencies mapped in that particular interval.
Agency location can be presented in a number of different ways.
For regional distribution of agencies we use the United Kingdom’s ITL1 regions. This stands for International Territorial Level, a geocode standard for subdividing the United Kingdom for statistical purposes and is used by the Office for National Statistics (ONS).
Our partners at The Data City provide us with this data for agencies based on registered and operating addresses. If an agency has operating addresses in more than one region, it will be counted more than once.
Investment is an almost entirely London and South East story
London attracts 54.0% of all investment funding into the agency sector and the South East a further 36.0%, together accounting for 90% of total investment. The rest of the UK competes for the remaining 10%, with the East of England (2.1%), North West (2.0%) and East Midlands (1.9%) the next-placed.
Scotland receives 0.7%, the South West 0.6% and Wales just 0.1%. Yorkshire and the Humber, which is the fifth-largest regional agency community by number and one of the fastest-growing, receives only 0.4% of investment. The concentration of private investment in London and the South East is even more extreme than the concentration of revenue, and reflects the geographic clustering of venture capital and growth investment infrastructure in and around the capital.
Total investment funding by region
About the data
Our partners at The Data City provide us with data on investment funding via Dealroom.
Agency location can be presented in a number of different ways.
For regional distribution of agencies we use the United Kingdom’s ITL1 regions. This stands for International Territorial Level, a geocode standard for subdividing the United Kingdom for statistical purposes and is used by the Office for National Statistics (ONS).
Our partners at The Data City provide us with this data for agencies based on registered and operating addresses. If an agency has operating addresses in more than one region, it will be counted more than once.
Innovation funding is more evenly distributed
The distribution of Innovate UK funding offers a markedly more regionally balanced picture than private investment. London leads with 22.3%, followed by Northern Ireland (19.7%) and The South East (15.0%). The South West (11.6%) and North West (11.0%) also receive meaningful shares.
Scotland, despite its relatively strong agency presence, receives only 2.2%, and the East Midlands just 0.5%. Northern Ireland’s performance in Innovate UK funding likely reflects a combination of targeted innovation support, active engagement with public funding mechanisms and possibly a concentration of agencies in research-intensive specialisms within the region.
Total Innovate UK funding by region
About the data
Innovate UK grant funding data includes the total amount of grant funding to agencies we have mapped and the public descriptions of the successful funding bids.
Agency location can be presented in a number of different ways.
For regional distribution of agencies we use the United Kingdom’s ITL1 regions. This stands for International Territorial Level, a geocode standard for subdividing the United Kingdom for statistical purposes and is used by the Office for National Statistics (ONS).
Our partners at The Data City provide us with this data for agencies based on registered and operating addresses. If an agency has operating addresses in more than one region, it will be counted more than once.
Agency regions and questions for the sector
The regional data raises a question at the heart of the UK Industrial Strategy’s creative industries ambitions: what does it actually mean to build a truly national creative economy?
The tension between revenue concentration and value-added performance is perhaps the defining feature of regional data we present here. London generates 63.7% of sector turnover but only 47% of sector GVA, and its GVA per head is lower than the South West’s. Meanwhile, the North East grows fastest, Yorkshire and the Humber performs above expectation on GVA per head, and Northern Ireland overperforms dramatically on Innovate UK funding.
The data suggests that the agency sector outside London is structurally different in ways that create both distinct challenges and genuine opportunities. The Industrial Strategy’s Creative Places Growth Fund, with its emphasis on regional cluster development, needs to engage with that complexity rather than treating regional investment as simple redistribution from the centre.
When it comes to investment, the near-total concentration of funding in one corner of the country suggests perhaps an information gap as much as a geographical preference. If agencies in regions beyond London and the South East are growing at rates comparable to or even greater than London, the question is not so much whether there are investable businesses outside the capital (the data suggests there are), but whether the investment community has the sector intelligence to find and evaluate them.
What is clear is that the difference between the regions needs further examination, especially in light of the UK Industrial Strategy. Before the different regions of the UK can be properly supported based on their unique characteristics, whether in terms of investment and innovation funding or education and skills support, these characteristics need to be fully understood, from the types of agencies operating there and driving agency success, to where there might be shortfalls that could benefit from additional support.
Find an agency
Find the right agency. Faster.
High‑quality, hand‑picked agency lists built from our comprehensive data and around your needs.