

Contents
- High growth agencies at a glance
- How is agency age reflected in the high growth data?
- Does getting bigger mean growing faster?
- Which capabilities are powering the high growth agencies?
- Where are the jobs being made within high growth agencies?
- What does high growth cost in productivity?
- Does high growth belong to London or the regions?
- Are high growth agencies leaving women behind?
- So what makes a high growth agency?
As we saw in the Agency by Agency Atlas, published earlier this year, the majority of agencies in the UK are stable. Roughly seven in ten sit in the stable growth band, and the average growth rate is 3.5%. But against that backdrop, there is a small cohort that is moving in a different direction. Our most recent mapping has identified 2,027 agencies with an average growth rate of more than 20% per year. Together they represent 8.2% of all active agencies and they are, if we are to measure momentum by growth, by far and away the part of the sector where it is concentrated.
But growth is only the beginning of the story. These 2,027 agencies employ almost a third of the entire agency workforce and generate around a quarter of the sector’s turnover and GVA. They have attracted, thus far, a small share of private investment and tend to skew more towards a certain stage of the agency life cycle. In this report we are going to take a closer look at these agencies and what makes them distinctive, as well as exploring what these findings might mean for the agency sector as a whole.
High growth agencies at a glance
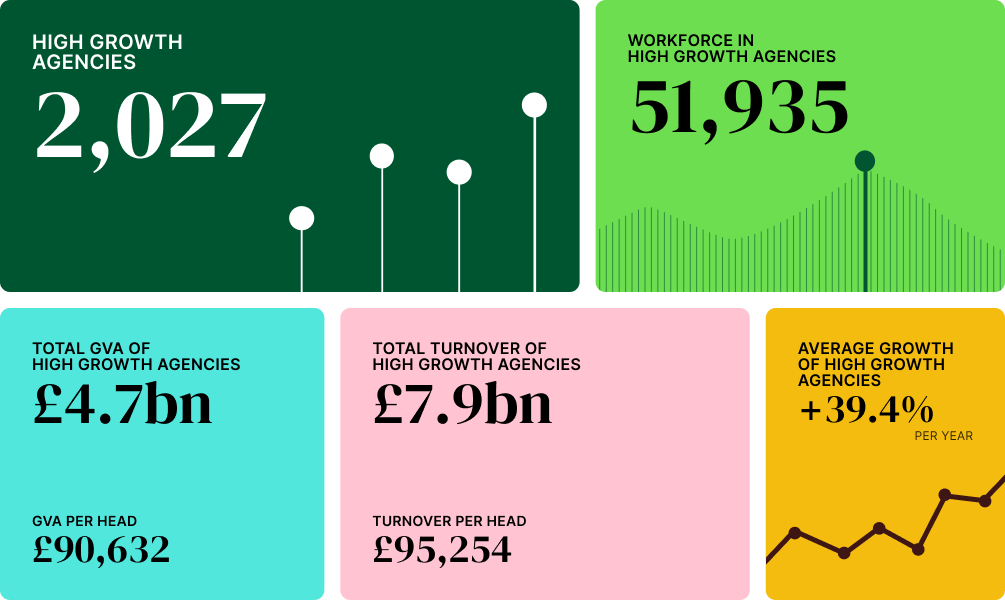
The 2,027 agencies we have mapped in the high growth band make up 8.2% of active agencies, employ 32.8% of the total agency workforce and generate 24.2% of sector turnover and 25.6% of gross value added. Despite their scale, they fall below the sector average on turnover per head and GVA per head, pointing to a cohort that is still investing in growth.
As we will go on to explore, they are concentrated not among the youngest of agencies but in the six-to-ten year band, which accounts for more than half (52.6%) of the high growth cohort. And within this group, scale and speed move differently to the wider sector, as it is the largest high growth agencies that are growing fastest of all.
Specialisms such as Data and Analytics, as well as Digital and AI Transformation are the capabilities expanding fastest within the cohort, and while high growth agencies attract 8.5% of private investment into the agency sector, similar to their share of active agencies, they have received 30.4% of all Innovate UK grant funding. They are slightly less likely to be women-founded or women-led than the wider sector, and they are slightly more likely to be located in London.
How is agency age reflected in the high growth data?
A common assumption might be that the fastest growing agencies are the newest ones, and to a certain extent this holds, but the picture is slightly more complicated. The youngest of the high growth agencies we have mapped do have the high average growth, with agencies in the cohort up to five years old posting an average growth rate of 52.4%.
Average growth within high growth agencies by age
About the data
Growth rates are provided by our partners at The Data City and are based on the annual headcount growth of any given agency we have mapped. Headcount growth is based on employee count data and turnover data, and to account for the lag in reporting, The Data City’s machine-learning platform can make an accurate best estimate. If an agency has less than three years reported data on employee number, no estimate is made and no growth data is reported. Growth rates for any given cohort or list of agencies is based on the growth rates of active agencies only.
Our data on agency age is based on company births and deaths, as registered with Companies House.
However, within the cohort of high growth agencies, the very youngest are a relatively small part of the story, with only 11.9%. Agencies that are aged six to ten years account for more than half of the entire high growth group (52.6%) while still growing at an average growth rate of 40.1%.
Share of high growth agencies by age
About the data
We map the number of agencies in the UK agency sector together with our partners at The Data City, whose sophisticated machine-learning tool allows us to find and categorise active agencies after adjustment for dormant companies and those in liquidation or administration.
Our data on agency age is based on company births and deaths, as registered with Companies House.
This is notably different to the sector as a whole. Across all agencies, it is the youngest cohort that grows the fastest (at an average of 8.9%), with growth trailing off sharply towards maturity. Among high growth agencies, the youngest still lead on pace, but the volume clusters at what we might call adolescence, in the period after the fragility of the start-up years but before the stability of age.
Does getting bigger mean growing faster?
Across the sector as a whole, the smallest agencies dominate by number, with six in ten agencies employing just one to two people. Among high growth agencies, these nano agencies only make up 12% of the entire cohort, with almost half (44.8%) sitting in the three-to-ten band and a further 19.3% in the eleven-twenty-band.
Share of high growth agencies by size
About the data
We map the number of agencies in the UK agency sector together with our partners at The Data City, whose sophisticated machine-learning tool allows us to find and categorise active agencies after adjustment for dormant companies and those in liquidation or administration.
Data for employees / headcount is provided by our partners at The Data City based on reporting to Companies House. As there can be a lag in reporting, The Data City’s machine-learning platform can make an accurate best estimate. If an agency has less than three years reported data on employee number, no estimate is made and no data is reported.
When it comes to growth rates within the high growth cohort, growth accelerates with size, from an average of 23.7% among the smallest agencies to 61.5% for agencies of 251 people or more. What is worth considering is how many of these larger agencies will, in future years, drop out of the high growth cluster having reached a certain size, and how many will continue to show these levels of growth.
Average growth of high growth agencies by size
About the data
Growth rates are provided by our partners at The Data City and are based on the annual headcount growth of any given agency we have mapped. Headcount growth is based on employee count data and turnover data, and to account for the lag in reporting, The Data City’s machine-learning platform can make an accurate best estimate. If an agency has less than three years reported data on employee number, no estimate is made and no growth data is reported. Growth rates for any given cohort or list of agencies is based on the growth rates of active agencies only.
Data for employees / headcount is provided by our partners at The Data City based on reporting to Companies House. As there can be a lag in reporting, The Data City’s machine-learning platform can make an accurate best estimate. If an agency has less than three years reported data on employee number, no estimate is made and no data is reported.
Which capabilities are powering the high growth agencies?
When we look at the 29 agency specialisms we have mapped and the share of active agencies offering these capabilities, the high growth cohort looks quite similar to the wider sector. The capabilities most commonly found among high growth agencies broadly mirror those in the sector as a whole, such as Website and UX/UI Design (26.9% of high growth agencies), Digital (26.8%) and Design and Branding (14.1%).
Share of high growth agencies by specialism
About the data
We map the number of agencies in the UK agency sector together with our partners at The Data City, whose sophisticated machine-learning tool allows us to find and categorise active agencies after adjustment for dormant companies and those in liquidation or administration.
Depending on the individual agency and the services they offer, agencies can appear in more than one of our subsector or specialism lists.
But even within a cohort where everyone is growing at an average rate of more than 20%, there are some interesting trends when we look at the average growth rates within the cohort based on these specialisms. The highest average growth rates belong to Data and Analytics (47.6%), Digital and AI Transformation (46.3%), Direct Marketing (45.0%) and Influencer (44.6%). These are also the specialisms, as we explored in the Atlas, that are driving growth across the sector as a whole.
Average growth of high growth agencies by specialism
For those interested in using our mapping to find an agency, the intersection of a growth-orientated specialism and a high growth trajectory is where momentum is concentrated, and perhaps offers pointers towards a direction of travel for the agency sector as a whole.
Where are the jobs being made within high growth agencies?
The cohort of high growth agencies represents less than one in ten active agencies in the UK, but they employ between them almost a third (32.8%) of the entire UK agency workforce. Digging a little deeper into the data, we can see that there are certain specialisms where the share of employees is notably higher than the share of active agencies within the cohort. For example, Digital and AI Transformation agencies account for only 4.3% of high growth agencies by number, but 17.5% of the high growth agency workforce.
Share of high growth agency workforce by specialism
About the data
Data for employees / headcount is provided by our partners at The Data City based on reporting to Companies House. As there can be a lag in reporting, The Data City’s machine-learning platform can make an accurate best estimate. If an agency has less than three years reported data on employee number, no estimate is made and no data is reported.
Depending on the individual agency and the services they offer, agencies can appear in more than one of our subsector or specialism lists.
For those interested in how the UK Industrial Strategy can grow the creative industries as a source of good jobs across the country, a cohort that combines expansion with intensive hiring is the kind of thing the strategy is hoping to identify and support. So what conditions would allow agencies like these to keep hiring, and how can access to talent and access to capital be supported and targeted to the right places?
What does high growth cost in productivity?
As mentioned earlier in the report, one of the key findings about the cohort of high growth agencies is the fact that, for all their momentum and contribution to employment in the sector, these agencies are not, on a per-head basis, necessarily the most productive.
High growth agencies generate £7.9bn in turnover, which is 24.2% of the sector total, and contribute £4.7bn in gross value added, or 25.6% of the sector’s total GVA. Both these numbers clearly show an outsized contribution, for 8.2% of all agencies. But because they employ such a large share of the workforce, those totals are spread thin per person. Their turnover per head stands at £95,254, below the sector average of £129,856, and their GVA per head of £90,632 is also below the sector average of £94,452.
At the same time, there are some specialisms within high growth agencies where the GVA-per-head is outperforming the sector average.
GVA per head of high growth agencies by specialism
About the data
GVA stands for ‘Gross Value Added’ and our GVA data is provided by our partners at The Data City and is estimated at the company level using official GVA (as defined by ONS) and employment data.
GVA-per-head is calculated based on the estimated GVA at company level and the number of employees / headcount, as provided by our partners at The Data City based on reporting to Companies House. As there can be a lag in reporting, The Data City’s machine-learning platform can make an accurate best estimate. If an agency has less than three years reported data on employee number, no estimate is made and no data is reported.
Depending on the individual agency and the services they offer, agencies can appear in more than one of our subsector or specialism lists.
How is private investment and innovation funding flowing into high growth agencies?
In terms of 2,027 high growth agencies we have mapped, they have attracted 8.5% of all investment funding, roughly in line with their share of agency numbers (8.2%), but far below their share of employees, turnover or GVA within the sector as a whole. On measures that might matter most to an investor, such as economic contribution and, of course, growth, this cohort of agencies is relatively under-capitalised.
Within the cohort, investment into high growth agencies is dominated by two specialisms, Search and Performance (24.2%) and Integrated and Full Service (23.2%), while a long list of others, including some of the fastest-growing capabilities such as Digital and AI Transformation, Direct Marketing and Media, have no meaningful recorded investment at all. Geographically, capital is even more concentrated: 68.5% of all investment into high growth agencies flows to London, well ahead of the capital’s 45.9% share of high growth agencies by number.
Where private investment is cautious, public innovation funding tells a different story. High growth agencies have received 30.4% of all Innovate UK funding flowing into the agency sector, nearly four times their share of agency numbers. This is a cohort that the public innovation system is backing far more readily than the private market is.
Does high growth belong to London or the regions?
On one measure, London’s dominance is overwhelming. The capital is home to 45.9% of all high growth agencies and 60.1% of the high growth workforce, a concentration even greater by employment than by agency number. Manchester (8.3% of agencies), Leeds (5.2%) and Birmingham and Wolverhampton (3.3%) follow some distance behind.
Share of high growth agencies by city cluster
About the data
We map the number of agencies in the UK agency sector together with our partners at The Data City, whose sophisticated machine-learning tool allows us to find and categorise active agencies after adjustment for dormant companies and those in liquidation or administration.
For the city distribution of agencies we are looking at the OECD-defined functional urban areas (FUA) or the UK. An FUA is composed of a core city and its commuting zones.
Our partners at The Data City provide us with this data for agencies based on registered company address.
Interestingly, the momentum within the cohort of high growth agencies is found beyond the capital city. The highest average growth rates within the cohort belong to regional clusters: Leicester (47.8%), Newcastle upon Tyne (47.0%), Bristol (46.5%) and Sheffield (43.2%), with London some way down the list at 39.9%.
About the data
Growth rates are provided by our partners at The Data City and are based on the annual headcount growth of any given agency we have mapped. Headcount growth is based on employee count data and turnover data, and to account for the lag in reporting, The Data City’s machine-learning platform can make an accurate best estimate. If an agency has less than three years reported data on employee number, no estimate is made and no growth data is reported. Growth rates for any given cohort or list of agencies is based on the growth rates of active agencies only.
For the city distribution of agencies we are looking at the OECD-defined functional urban areas (FUA) or the UK. An FUA is composed of a core city and its commuting zones.
Our partners at The Data City provide us with this data for agencies based on registered company address.
Investment, meanwhile, pulls firmly back towards the capital. London draws 68.5% of all investment into high growth agencies, far more than its 45.9% share of the cohort, while regional clusters that grow fastest attract comparatively little. The result is a geography in which regional clusters produce some of the sector’s fastest growing agencies, but the capital captures a disproportionate share of the capital. For the Industrial Strategy’s ambition to build a genuinely national creative economy and for investors willing to look beyond the M25, that mismatch feels like an opportunity.
Are high growth agencies leaving women behind?
Among the high growth agencies cohort, 19.9% are women-founded and 17.2% are women-led, while women make up 29.7% of all directors. Each figure sits below the sector-wide equivalent, where 21.0% of agencies are women-founded, 19.7% are women-led and 32.2% of directors are women.
Founder gender split within high growth agencies
The same drop-off between founding and leading that we observe across the wider sector is present here too, and if anything slightly more pronounced. Women are founding high growth agencies at close to the sector rate but are less well represented in their current leadership, suggesting that in the fastest-growing part of the agency community, as in the sector at large, women are entering leadership at the founding stage and then leaving it, or being outnumbered within it, as agencies grow.
Leadership gender split within high growth agencies
For a Creative Industries Sector Plan with ambitions for inclusive growth, understanding why the sector’s fastest risers are less gender-balanced than a wider sector that is already far from equal, is a question that cannot be left unasked.
So what makes a high growth agency?
One thing that data shows, across an industry as diverse as the UK agency sector, there is no clear portrait of a high growth agency. There are some pointers that might help us identify what type of agency might develop to join this high growth cohort, and of course there are dynamics within the existing cohort, not least the speed of growth among the largest of these agencies, that might point to where growth will eventually level out and they will drop below the 20%-plus average growth that brought them membership of this cohort in the first place.
The high growth agency is not, typically, a brand-new start-up, but one that has come through its first few years and hit its stride, most often between six and ten years old. It is a business of some scale and a substantial employer, accounting for almost a third of the sector’s workforce, and it is often built around the capabilities pulling ahead across the whole sector, data, digital transformation and the expanding role of AI.
For investors, acquirers and B2B buyers looking to find an agency, for policymakers shaping the Creative Industries Sector Plan, and for agencies themselves or anyone seeking to understand where the UK’s creative economy is heading, these 2,027 agencies offer up some clues but, as always with our mapping of the UK agency sector, pose as many questions as answers.
Bespoke agency intelligence
Looking for a high growth agency? Whether for a pitch, a partnership, an acquisition or a market entry, finding the right agency requires knowing who is out there, what they actually do, how they are performing and whether they match what you need.
Our agency directory is the only comprehensive list of UK agencies enriched with data on capabilities and specialisms, growth signals and other performance indicators. We use it to deliver intelligence in the three ways; as a one-off curated dataset, as an ongoing agency radar, or as part of a broader advisory relationship.
Photo by Riccardo Ginevri on Unsplash
Latest articles and reports
View all
- Article
Transformation nation: What the data tells us about Digital and AI Transformation agencies
Our insight into Digital and AI Transformation agencies, drawing on the Agency by Agency Atlas 2026 and its supporting specialism data.
Read more
- Report
The South West: a smaller share of agencies, a bigger share of value
What makes the agency landscape in the South West distinctive?
Read more
- Article
The data on the data agencies: What makes Data and Analytics stand out
Our insight into Data and Analytics agencies we have mapped, drawing on the Agency by Agency Atlas 2026 and its supporting specialism data.
Read more