

Contents
- Larger than average, but what’s happening with productivity?
- How much of this specialism is actually growing?
- Does growth belong to the youngest Digital and AI Transformation agencies?
- So is it youth… or is it size that matters?
- Where is the specialism concentrated and where is growth happening?
- Questions for the sector
In terms of the number of active agencies we have mapped, Digital and AI Transformation is in the mid-range of specialisms and far below those that define the sector numerically, such as Website and UX/UI design or Design and Branding. Altogether the 701 agencies we have mapped offer Digital and AI Transformation services, and in looking more closely at these agencies we can see how the specialism stands apart from what we can see across the UK agency sector as a whole.
Key to this is the size and shape of the specialism. When measured by agency count, Digital and AI Transformation services account for 2.8% of the UK agency sector. But if we measure size based not on active companies but on workforce, the 19,288 people we have mapped working for these agencies are 10.3% of the entire UK agency workforce. Immediately we can see how these agencies might be different, with a crude average of roughly 27 employees per agency against a sector where the average is closer to eight and around six in ten agencies employ just one or two people.
Larger than average, but what’s happening with productivity?
Straight away we can see that this is likely to be a specialism built on larger agencies and there is an interesting shift from the sector as a whole when it comes to how these firms convert scale into value. This 2.8% of active agencies and 10.3% of the workforce generates 11.2% of sector turnover, with an average turnover per head comfortably above the sector average. Yet when it comes to GVA, the combined contribution of Digital and AI Transformation workforce is lower than its share of total employees at 8.5%, with their GVA per head is £80,816, well below the all-agency figure of £94,452 we published in the Agency by Agency Atlas 2026.
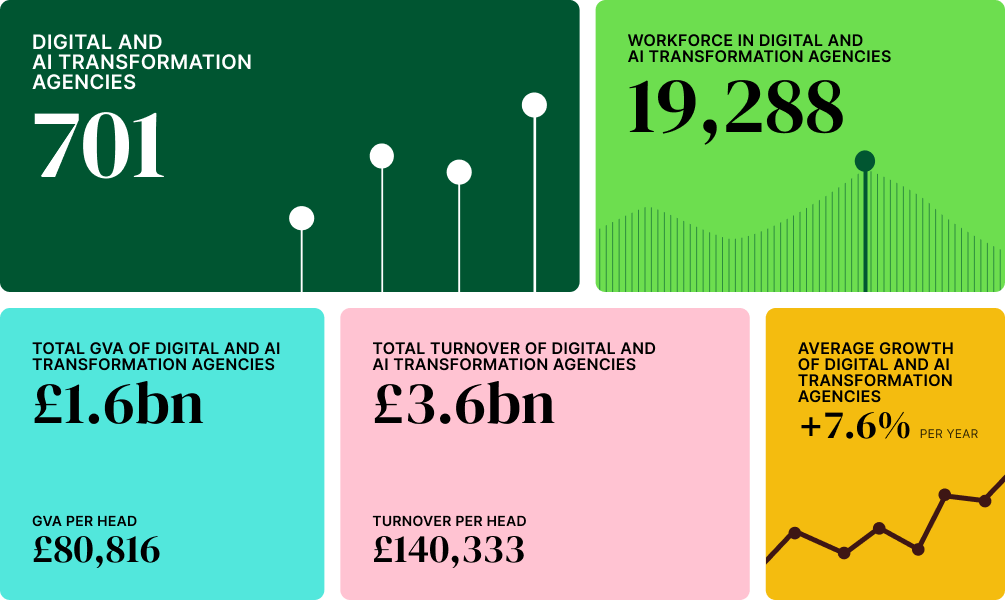
High revenue per person but a below-average value suggests a large cost base, such as the licensing, technology, platforms and subcontracted delivery that Digital and AI Transformation agencies often require to do their work. As always when we compare the data across such different specialisms and capabilities that can be found within the UK agency sector as a whole, it is important to keep these differences in mind when holding them up against each other.
When it comes to investment, the specialism attracts 2.9% of the total investment into the agency sector, in line with its share of active agencies, with 7.7% of innovation funding (as measured by Innovate UK grants) flowing into Digital and AI Transformation agencies. Another way in which the specialism diverges from the wider sector is when it comes to gender and leadership. Only 8.9% of Digital and AI Transformation agencies are women-founded, compared to 21.0% across the sector as a whole, and only 10.3% are women-led, compared to 19.7%.
One area where agencies offering Digital and AI Transformation services are outperforming much of the sector is growth. Indeed, with an average growth rate of 7.6%, this is the fifth highest average growth rate out of the 29 specialisms we have mapped and more than twice the overall sector average at 3.5%.
How much of this specialism is actually growing?
With more than double the sector rate of average growth, agencies offering Digital and AI Transformation services are considerably more stable than the headline figure might suggest. Our growth traffic light for the specialism shows that 59.7% of these agencies sit in the stable band, with 12.6% growing and 16.1% growing fast. That leaves 11.6% of Digital and AI Transformation agencies that are shrinking to some degree.
Growth rates of UK agencies
About the data
Growth rates are provided by our partners at The Data City and are based on the annual headcount growth of any given agency we have mapped. Headcount growth is based on employee count data and turnover data, and to account for the lag in reporting, The Data City’s machine-learning platform can make an accurate best estimate. If an agency has less than three years reported data on employee number, no estimate is made and no growth data is reported. Growth rates for any given cohort or list of agencies is based on the growth rates of active agencies only.
Our ‘Growth Traffic Light’ breaks down the percentage of agencies in any given group that land in one of five growth rate categories: Shrinking fast (below -20% annual growth), Shrinking (-20% to -10% annual growth), Stable (-10% to 10% annual growth), Growing (10% to 20% annual growth) and Growing Fast (over 20% annual growth). If part of the chart is empty, this means that there were no agencies mapped in that particular interval.
So while the average growth rate shows a specialism outperforming most of the others we have mapped, it is a little less than three in ten that are actually showing significant growth. This minority of fast-growing Digital and AI Transformation agencies is mostly responsible for the headline figure, and this is something we also saw across the sector as a whole in the Agency by Agency Atlas 2026, where a fast-growing group of agencies sits alongside a much larger stable core.
And even within this specialism, we can see that the growth within Digital and AI Transformation agencies is not distributed evenly, rather we can see that agency age and size both have an impact when we look at where growth is taking place.
Does growth belong to the youngest Digital and AI Transformation agencies?
When we explore the specialism based on the age of agencies we have mapped within, we can see that this looks like a story of youthful growth, with averages falling as agencies get older. Digital and AI Transformation agencies that are up to five years old have a high average growth rate of 24.0%, a number that drops sharply with agency age until we reach agencies sixteen years and older, where the average growth rate of 2.3% is below the wider sector average.
Average growth per year by age
About the data
Growth rates are provided by our partners at The Data City and are based on the annual headcount growth of any given agency we have mapped. Headcount growth is based on employee count data and turnover data, and to account for the lag in reporting, The Data City’s machine-learning platform can make an accurate best estimate. If an agency has less than three years reported data on employee number, no estimate is made and no growth data is reported. Growth rates for any given cohort or list of agencies is based on the growth rates of active agencies only.
Our data on agency age is based on company births and deaths, as registered with Companies House.
Our growth traffic light tells a similar story. A third of agencies that are up to five years old are growing fast, falling to 25.4% at six to ten years, 14.5% at eleven to fifteen, and only 6.7% among the oldest cohort. This group of agencies are also the most likely to be stable.
Growth rates by age
About the data
Growth rates are provided by our partners at The Data City and are based on the annual headcount growth of any given agency we have mapped. Headcount growth is based on employee count data and turnover data, and to account for the lag in reporting, The Data City’s machine-learning platform can make an accurate best estimate. If an agency has less than three years reported data on employee number, no estimate is made and no growth data is reported. Growth rates for any given cohort or list of agencies is based on the growth rates of active agencies only.
Our ‘Growth Traffic Light’ breaks down the percentage of agencies in any given group that land in one of five growth rate categories: Shrinking fast (below -20% annual growth), Shrinking (-20% to -10% annual growth), Stable (-10% to 10% annual growth), Growing (10% to 20% annual growth) and Growing Fast (over 20% annual growth). If part of the chart is empty, this means that there were no agencies mapped in that particular interval.
Our data on agency age is based on company births and deaths, as registered with Companies House.
What makes all of this especially interesting is that, perhaps surprisingly, this is not in the main a youthful specialism. Only 15.0% of the agencies we have mapped offering Digital and AI Transformation services are five years old or younger, while almost a third are in the oldest cohort.
Agency share by age
About the data
We map the number of agencies in the UK agency sector together with our partners at The Data City, whose sophisticated machine-learning tool allows us to find and categorise active agencies after adjustment for dormant companies and those in liquidation or administration.
Our data on agency age is based on company births and deaths, as registered with Companies House.
So while the engine of growth within the Digital and AI Transformation specialism is the group of young agencies, they are also the smallest cohort by number. There are some potential explanations for this, such as the ‘AI’ in the specialism’s name is fueling demand for new entrants, and further exploration would be needed to definitely answer the question of what is fueling growth at different stages of an agency’s lifecycle within this specialism in particular.
So is it youth… or is it size that matters?
When we explore the growth data for Digital and AI Transformation agencies through the lens of agency size, the data appears to be in contradiction to what we have learned about agency age. The average growth rates rise with headcount, with the smallest nano agencies (on average) shrinking, while the highest average growth rate landing in the 101 to 250 cohort before easing slightly for the very largest of agencies.
Average growth per year by headcount
About the data
Growth rates are provided by our partners at The Data City and are based on the annual headcount growth of any given agency we have mapped. Headcount growth is based on employee count data and turnover data, and to account for the lag in reporting, The Data City’s machine-learning platform can make an accurate best estimate. If an agency has less than three years reported data on employee number, no estimate is made and no growth data is reported. Growth rates for any given cohort or list of agencies is based on the growth rates of active agencies only.
Data for employees / headcount is provided by our partners at The Data City based on reporting to Companies House. As there can be a lag in reporting, The Data City’s machine-learning platform can make an accurate best estimate. If an agency has less than three years reported data on employee number, no estimate is made and no data is reported.
The traffic light gives more detail to this pattern, with 54.5% of agencies with 251 or more staff growing fast, as are 42.9% of those with 101 to 250, against just 3.6% of the smallest agencies offering these services.
Growth rates by headcount
About the data
Growth rates are provided by our partners at The Data City and are based on the annual headcount growth of any given agency we have mapped. Headcount growth is based on employee count data and turnover data, and to account for the lag in reporting, The Data City’s machine-learning platform can make an accurate best estimate. If an agency has less than three years reported data on employee number, no estimate is made and no growth data is reported. Growth rates for any given cohort or list of agencies is based on the growth rates of active agencies only.
Our ‘Growth Traffic Light’ breaks down the percentage of agencies in any given group that land in one of five growth rate categories: Shrinking fast (below -20% annual growth), Shrinking (-20% to -10% annual growth), Stable (-10% to 10% annual growth), Growing (10% to 20% annual growth) and Growing Fast (over 20% annual growth). If part of the chart is empty, this means that there were no agencies mapped in that particular interval.
Data for employees / headcount is provided by our partners at The Data City based on reporting to Companies House. As there can be a lag in reporting, The Data City’s machine-learning platform can make an accurate best estimate. If an agency has less than three years reported data on employee number, no estimate is made and no data is reported.
What is interesting is that there is high average growth rates in the youngest agencies (which you might expect to be the smallest, hence the rapid growth) but also within the largest agencies (which you might expect to be the most well-established). Perhaps it is simply that the fastest-growing young agencies are moving rapidly through the headcount brackets while the older cohort is being held down by a substantial number of small, micro and nano agencies where the average growth rate is much lower. For anyone interested in finding individual agencies that meet certain growth characteristics across different criteria, this is where our Agency Radar services can help.
Where is the specialism concentrated and where is growth happening?
Digital and AI Transformation is a London-centric specialism, and more so that the wider sector, with 51.2% of the specialism’s active agencies operating in the capital and 56.7% of the specialism’s workforce. Across the UK agency sector as a whole, the Agency by Agency Atlas 2026 shows that London accounts for 41.9% of active agencies and 55.4% of the agency workforce.
Agency share by cluster
About the data
We map the number of agencies in the UK agency sector together with our partners at The Data City, whose sophisticated machine-learning tool allows us to find and categorise active agencies after adjustment for dormant companies and those in liquidation or administration.
For the city distribution of agencies we are looking at the OECD-defined functional urban areas (FUA) or the UK. An FUA is composed of a core city and its commuting zones.
Our partners at The Data City provide us with this data for agencies based on registered company address.
As with the UK agency sector as a whole, the fact that the share of active agencies in London is lower than the city’s share of the agency workforce suggests that the capital hosts, on average, larger operations. Beyond London, we can see something similar in Manchester, where 8.8% of Digital and AI Transformation agencies employ 12.0% of the specialism’s workforce, and Edinburgh where 2.7% of the specialism’s agencies account for 5.9% of the total employees.
Employee share by cluster
About the data
Data for employees / headcount is provided by our partners at The Data City based on reporting to Companies House. As there can be a lag in reporting, The Data City’s machine-learning platform can make an accurate best estimate. If an agency has less than three years reported data on employee number, no estimate is made and no data is reported.
For the city distribution of agencies we are looking at the OECD-defined functional urban areas (FUA) or the UK. An FUA is composed of a core city and its commuting zones.
Our partners at The Data City provide us with this data for agencies based on registered company address.
When it comes to growth, we can see that there are a number of city clusters that outperform London, which itself has an above average growth rate of 9.0%. Bristol leads the way with 17.5% average growth rate, followed by Sheffield (16.0%), Leicester (15.1%) and Edinburgh (13.9%). One thing it is really important to remember here is that we are speaking about relatively small cohorts of agencies, where one or two individual outliers can really influence the averages within any given location.
Average growth per year by cluster
About the data
Growth rates are provided by our partners at The Data City and are based on the annual headcount growth of any given agency we have mapped. Headcount growth is based on employee count data and turnover data, and to account for the lag in reporting, The Data City’s machine-learning platform can make an accurate best estimate. If an agency has less than three years reported data on employee number, no estimate is made and no growth data is reported. Growth rates for any given cohort or list of agencies is based on the growth rates of active agencies only.
For the city distribution of agencies we are looking at the OECD-defined functional urban areas (FUA) or the UK. An FUA is composed of a core city and its commuting zones.
Our partners at The Data City provide us with this data for agencies based on registered company address.
That said, the faster rate of growth in cities such as Bristol, Sheffield and elsewhere when compared to London is something that can also be seen across the wider UK agency sector as a whole. In the Agency by Agency Atlas 2026, across all agencies in the UK, cities such as Manchester, Sheffield and Leicester all had average growth rates higher than London.
Questions for the sector
The data from the Digital and AI Transformation specialism offers plenty of interesting questions for the agency sector as a whole, and perhaps especially for those involved in the UK Industrial Strategy’s Creative Industries Sector Plan.
For such policy makers, it can certainly be argued that this specialism sits at the core of what the strategy is trying to achieve. Digital and AI Transformation is within the frontier capabilities that the sector plan is meant to encourage, and our data on innovation funding (7.7% of Innovate UK funding to 2.8% of active agencies) shows that it is already receiving research and development support ahead of its size, although not when the size of the specialism is measured by workforce (10.3%)
For investors and those active in M&A, the data on the size of Digital and AI Transformation agencies suggests where there might be opportunities compared to elsewhere in the sector. And yet, the fact that currently investment into the specialism is only roughly proportionate to its size (2.9%), even though these agencies are showing above average growth, raises some familiar questions around sector intelligence to identify the best opportunities, particularly outside London, and is something that our bespoke services can certainly help with.
One final thing to flag again is the subject of gender and leadership data. With only 8.9% of Digital and AI Transformation agencies founded by women, and only 10.3% led by women, the specialism is markedly less diverse than a sector that is itself only around a fifth women-led. For a specialism that should be positioned at the technological frontier, attracting investment, innovation funding and other support, this under-representation is something that the Industrial Strategy’s ambition for inclusive growth should certainly not ignore.
CTA: Bespoke agency intelligence
Searching for a Digital and AI Transformation agency? Whether for a pitch, a partnership, an acquisition or a market entry, finding the right agency requires knowing who is out there, what they actually do, how they are performing and whether they match what you need.
Our agency directory is the only comprehensive list of UK agencies enriched with data on capabilities and specialisms, growth signals and other performance indicators. We use it to deliver intelligence in the three ways; as a one-off curated dataset, as an ongoing agency radar, or as part of a broader advisory relationship.
Latest articles and reports
View all
- Report
High growth agencies: what sets the sector’s fastest risers apart?
Our latest report takes a more detailed look at agencies with an average growth rate of over 20%
Read more
- Report
The South West: a smaller share of agencies, a bigger share of value
What makes the agency landscape in the South West distinctive?
Read more
- Article
The data on the data agencies: What makes Data and Analytics stand out
Our insight into Data and Analytics agencies we have mapped, drawing on the Agency by Agency Atlas 2026 and its supporting specialism data.
Read more