

Contents
- Why does the South West punch so far above its weight?
- Is the South West an ageing agency landscape?
- Are South West agencies simply more substantial?
- Steady rather than spectacular: is the South West built for stability?
- A region defined by web, design and digital craft?
- Why do so many people work in creative, advertising and transformation?
- Where is the region growing?
- Which specialisms are thriving, and which look exposed?
- What makes the South West's agency landscape distinctive?
The South West is home to just under one in ten of the UK’s agencies, yet it accounts for a substantially larger share of the sector’s workforce, turnover and economic value. It is also, on the evidence of the data, the most productive agency region in the country. As part of our comprehensive mapping of the UK agency community, this analysis looks beneath the region’s headline numbers to ask what actually distinguishes the South West, and what its data tells anyone trying to find, invest in or shape policy around agencies based there.
Several findings stand out. The South West holds 9.1% of the UK’s agencies but 14.7% of the workforce and 16.3% of turnover, and leads every region in the UK on value added per employee. Its agencies are, on average, older and slightly larger than the national norm, with fewer of the one-to-two-person “nano” agencies that dominate the sector elsewhere. Growth is steady rather than spectacular, and the region seems to skew towards moderate, sustainable growth and away from both the fast-growing and fast-shrinking extremes.
And while frontier specialisms such as data, platform commerce and transformation are growing quickly here as they are nationally, the region receives a generous share of public innovation grants but almost none of the private investment flowing into the sector. That last gap is perhaps the single most important thing this data brings to light for investors and policymakers alike.
Why does the South West punch so far above its weight?
The clearest signal in the South West data is the mismatch between how many agencies operate there and how much they contribute. The region is home to 2,243 active agencies (9.1% of the UK total), but those agencies employ 28,866 people (14.7% of the entire UK agency workforce). On turnover, the gap is wider still as the region generates £5.33 billion (16.3% of the UK total) and contributes an estimated £3 billion in gross value added (16.4% of the sector as a whole).
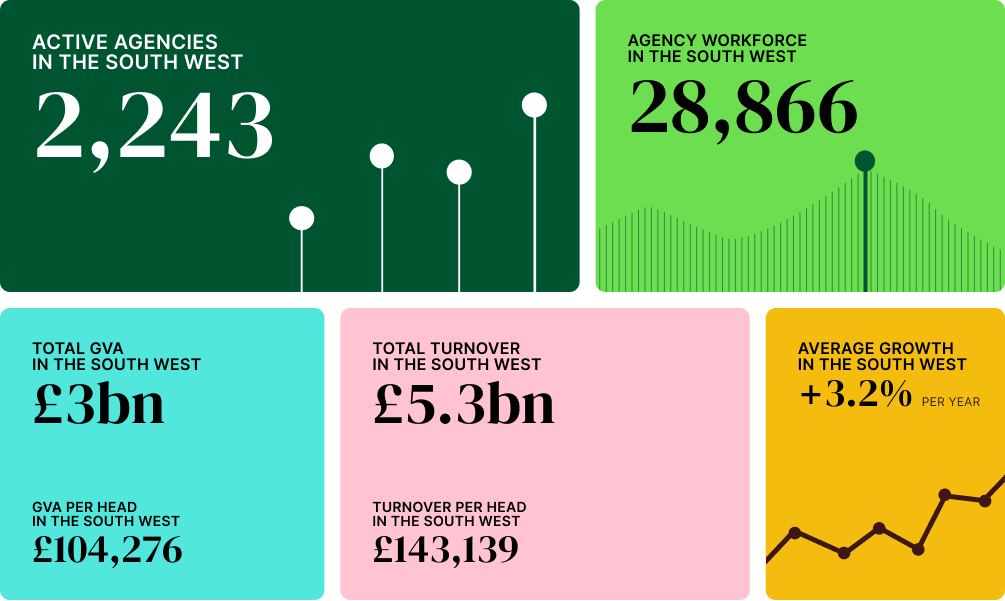
GVA per employee in the region stands at £104,276, comfortably above the sector average of £94,452. This is a pretty big difference and one which makes the South West the most productive agency region in the UK on this measure, ahead even of London, whose GVA per head sits at £95,515 despite the capital generating almost two thirds of all sector turnover.
The region also receives 16.2% of all Innovate UK grant funding flowing to the sector, broadly in line with its economic contribution, yet just 0.9% of investment funding. Public innovation support has found the South West while private capital, on the current evidence, has not. Whether that reflects a shortage of investable businesses or a shortage of investor intelligence about the region is a question the data alone cannot settle, but the productivity numbers suggest the businesses are there.
Is the South West an ageing agency landscape?
The South West is a notably more established region than the UK as a whole. More than a third of its agencies (35.44%) have been operating for sixteen years or more, against 30.1% nationally, while just 12.04% are within their first five years, compared with 16.1% across the UK.
Agency share by age
About the data
We map the number of agencies in the UK agency sector together with our partners at The Data City, whose sophisticated machine-learning tool allows us to find and categorise active agencies after adjustment for dormant companies and those in liquidation or administration.
Our data on agency age is based on company births and deaths, as registered with Companies House.
At every point the distribution is shifted towards maturity. That maturity is likely part of what drives the region’s strong productivity and turnover performance, but it also sharpens a question the Atlas raises nationally: with new agency formation across the UK falling since its 2019 peak, what happens when the pipeline of new entrants thins?
In a region already weighted towards older businesses, the renewal question is arguably more pressing than elsewhere. For the Industrial Strategy’s Creative Industries ambitions, which depend in part on new businesses entering to challenge established models, the formation slowdown deserves as much attention as the scale-up agenda.
Are South West agencies simply more substantial?
Alongside being older, agencies in the South West are, on average, slightly larger than their national counterparts. The region has proportionally fewer of the nano agencies that dominate the sector nationally and more agencies in the small-to-mid range.
Agency share by headcount
About the data
We map the number of agencies in the UK agency sector together with our partners at The Data City, whose sophisticated machine-learning tool allows us to find and categorise active agencies after adjustment for dormant companies and those in liquidation or administration.
Data for employees / headcount is provided by our partners at The Data City based on reporting to Companies House. As there can be a lag in reporting, The Data City’s machine-learning platform can make an accurate best estimate. If an agency has less than three years reported data on employee number, no estimate is made and no data is reported.
The difference is not dramatic, but it is consistent. Nationally, six in ten agencies have just one or two people, forming what we have described as a landscape of nano-businesses operating in a largely separate economy from the sector’s much larger players.
The South West tilts a little away from that pattern, with a firmer base of established small and mid-sized agencies. Combined with the region’s older profile and its workforce share running well ahead of its agency count, the picture is of a region whose agencies are, on average, more substantial and better staffed than across the UK as a whole.
Steady rather than spectacular: is the South West built for stability?
If the region leads on value, it is more measured on growth. The average growth rate for South West agencies is 3.2%, just below the sector average of 3.5%. The growth traffic light shows why: the region is concentrated in moderate growth rather than at the extremes.
Growth rates of agencies in the South West
Growth rates of UK agencies
About the data
Growth rates are provided by our partners at The Data City and are based on the annual headcount growth of any given agency we have mapped. Headcount growth is based on employee count data and turnover data, and to account for the lag in reporting, The Data City’s machine-learning platform can make an accurate best estimate. If an agency has less than three years reported data on employee number, no estimate is made and no growth data is reported. Growth rates for any given cohort or list of agencies is based on the growth rates of active agencies only.
Our ‘Growth Traffic Light’ breaks down the percentage of agencies in any given group that land in one of five growth rate categories: Shrinking fast (below -20% annual growth), Shrinking (-20% to -10% annual growth), Stable (-10% to 10% annual growth), Growing (10% to 20% annual growth) and Growing Fast (over 20% annual growth). If part of the chart is empty, this means that there were no agencies mapped in that particular interval.
The South West has a higher proportion of agencies growing moderately and a lower proportion growing fast than the sector as a whole. It also has slightly fewer agencies shrinking fast. The overall effect is a region that is a little less volatile at both ends and a little more weighted towards steady, sustainable expansion.
A region defined by web, design and digital craft?
By specialism, the South West leans firmly into the disciplines that numerically define the sector nationally, and then some. Website and UX/UI Design is the region’s most common specialism at 37.14%, ahead of the national share of 33.33%, followed by Digital at 23.67% and Design and Branding at 20.33%, both also above their national shares. The region over-indexes on Content, Search and Performance and SEO too, while sitting slightly below the national average on PR & Comms, Digital Product Design and Social Media.
Agency share by specialism
About the data
We map the number of agencies in the UK agency sector together with our partners at The Data City, whose sophisticated machine-learning tool allows us to find and categorise active agencies after adjustment for dormant companies and those in liquidation or administration.
Depending on the individual agency and the services they offer, agencies can appear in more than one of our subsector or specialism lists.
In other words, the South West’s agency base is weighted towards web, design and digital execution. That concentration is worth reading alongside a pattern the Atlas has identified across the country, namely that the most common specialisms are not the fastest-growing ones.
The disciplines the South West is most densely populated with are, for the most part, the mature, established services rather than the frontier ones, a point that becomes more interesting when we look at where the region’s growth is actually coming from.
Why do so many people work in creative, advertising and transformation?
While the region’s agencies are dominated by web and design specialisms, its workforce is concentrated elsewhere. The largest single share of the South West’s agency workforce (24.54%) sits in Creative and Advertising, followed by Digital and AI Transformation (21.32%), Digital (16.75%) and Integrated and Full Service (15.46%).
Employee share by specialism
About the data
Data for employees / headcount is provided by our partners at The Data City based on reporting to Companies House. As there can be a lag in reporting, The Data City’s machine-learning platform can make an accurate best estimate. If an agency has less than three years reported data on employee number, no estimate is made and no data is reported.
Depending on the individual agency and the services they offer, agencies can appear in more than one of our subsector or specialism lists.
The explanation is one of agency scale rather than agency count. So the specialisms that define the region by number are not the ones that define it by employment. For anyone trying to find an agency in the South West, this is useful information as the density of a specialism tells you how many agencies offer it, rather than how much capacity or scale sits behind it.
Where is the region growing?
The fastest-growing disciplines in the region are Amazon and Marketplace at 15.50% average growth, Conversion at 13.60%, Data and Analytics at 12.00% and Digital and AI Transformation at 10.20%.
Average growth per year by specialism
Several of these run ahead of their national equivalents. Conversion is the most eye-catching as it grows at 13.60% in the South West against just 4.20% across the UK, and Digital and AI Transformation, Amazon and Marketplace, Social Media and Digital all grow faster in the region than nationally.
This echoes the Atlas finding that, within the agency sector, growth is most likely found in data intelligence, platform commerce, transformation and social purpose rather than in the web and design services that dominate by number. In the South West, those specialisms are growing briskly even though relatively few agencies operate in them.
It’s worth noting that the fastest-growing specialisms are also among the smallest by agency count, which makes their average growth rates more volatile and more sensitive to the performance of a handful of businesses. The direction of travel is there but the precise percentages for the smallest specialisms should be read as indicative rather than definitive.
Which specialisms are thriving, and which look exposed?
Using our growth traffic light to explore these rates in a little more detail and we can see which specialisms are genuinely thriving and which carry more risk through their volatility.
Data and Analytics stands out as both fast-growing and stable: 24.24% of the region’s Data and Analytics agencies are growing fast, and none are shrinking fast. Social Purpose and Sustainability shows a similar profile, with 17.39% growing fast and none shrinking fast, alongside Search and Performance and Social Media, both with strong growing-fast shares.
Growth rates by specialism
About the data
Growth rates are provided by our partners at The Data City and are based on the annual headcount growth of any given agency we have mapped. Headcount growth is based on employee count data and turnover data, and to account for the lag in reporting, The Data City’s machine-learning platform can make an accurate best estimate. If an agency has less than three years reported data on employee number, no estimate is made and no growth data is reported. Growth rates for any given cohort or list of agencies is based on the growth rates of active agencies only.
Our ‘Growth Traffic Light’ breaks down the percentage of agencies in any given group that land in one of five growth rate categories: Shrinking fast (below -20% annual growth), Shrinking (-20% to -10% annual growth), Stable (-10% to 10% annual growth), Growing (10% to 20% annual growth) and Growing Fast (over 20% annual growth). If part of the chart is empty, this means that there were no agencies mapped in that particular interval.
Depending on the individual agency and the services they offer, agencies can appear in more than one of our subsector or specialism lists.
Others combine high growth with high volatility. Conversion has the largest growing-fast share of any South West specialism at 40.00%, but also a 13.33% shrinking-fast share, marking it as a high-risk, high-reward discipline. Amazon and Marketplace is similarly polarised, with a third of agencies growing fast but more than one in ten shrinking fast.
At the more stable end, established craft specialisms such as Design and Branding, Video and Production, and Market Research show low average growth and are heavily concentrated in the stable band, consistent with their maturity. As with the growth data above, several of the more volatile specialisms are small by agency count, so the extremes should be treated as signals of pattern rather than precise measures.
What makes the South West’s agency landscape distinctive?
Taken together, the data describes a region that does not conform to the national template. Where the UK sector as a whole is a landscape of numerous, mostly tiny, relatively young agencies, the South West is older, a little larger, more established and markedly more productive. It holds less than a tenth of the country’s agencies but generates a sixth of the sector’s turnover and value, and leads every region in the UK on value added per employee. Its growth is steady and its base is mature, weighted towards the web, design and digital-craft specialisms, even as its fastest growth accumulates in areas such as data, conversion and transformation.
At the same time, there remains an interesting gap within a productive region that receives a fair share of public innovation funding and yet attracts little of the sector’s private investment. This is a puzzle that speaks directly to the Industrial Strategy’s ambition to build a creative economy that is genuinely national rather than concentrated in the capital.
For investors weighing where value is being created outside London, for policymakers translating the Creative Industries Sector Plan into regional action, and for anyone looking to find and appoint an agency in the South West, one thing is clear: this is a region that rewards a closer look.
Bespoke agency intelligence
Looking for an agency in the South West? Whether for a pitch, a partnership, an acquisition or a market entry, finding the right agency requires knowing who is out there, what they actually do, how they are performing and whether they match what you need.
Our agency directory is the only comprehensive list of UK agencies enriched with data on capabilities and specialisms, growth signals and other performance indicators. We use it to deliver intelligence in the three ways; as a one-off curated dataset, as an ongoing agency radar, or as part of a broader advisory relationship.
Photo by Lāsma Artmane on Unsplash
Looking for an agency?
Get a shortlist that actually fits.
This list is a starting point. We use data like this to help you define the right criteria and deliver a bespoke agency shortlist built around your goals. Get in touch to start your search.
Latest articles and reports
View all
- Report
High growth agencies: what sets the sector’s fastest risers apart?
Our latest report takes a more detailed look at agencies with an average growth rate of over 20%
Read more
- Article
Transformation nation: What the data tells us about Digital and AI Transformation agencies
Our insight into Digital and AI Transformation agencies, drawing on the Agency by Agency Atlas 2026 and its supporting specialism data.
Read more
- Article
The data on the data agencies: What makes Data and Analytics stand out
Our insight into Data and Analytics agencies we have mapped, drawing on the Agency by Agency Atlas 2026 and its supporting specialism data.
Read more