

Contents
- Key findings
- Agencies like yours: Our analysis
- Our Agency Radar
- The Data
- Company founding years: Your cohort
- Company founding years: All agencies
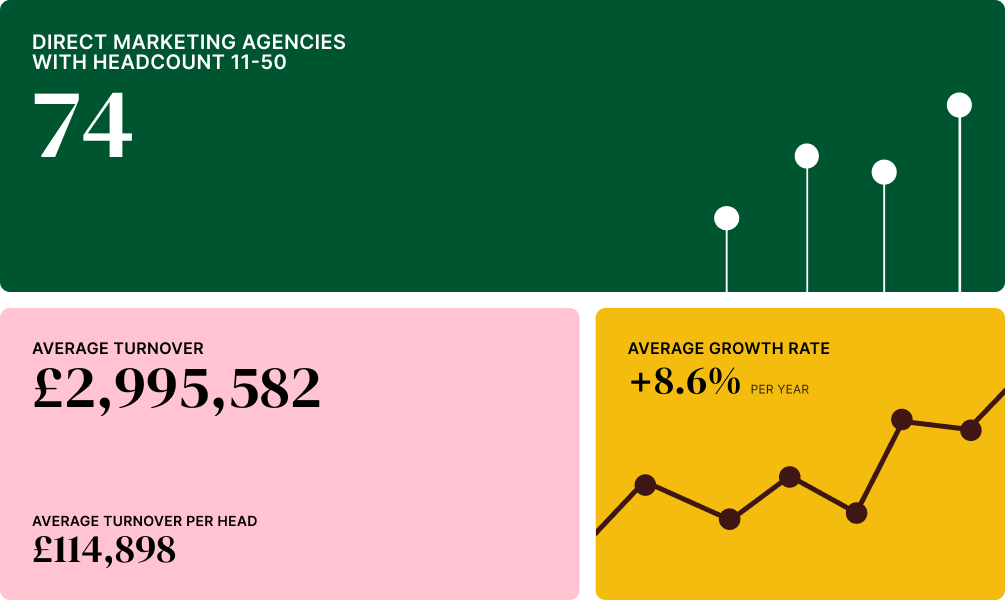
- Average growth rate for your cohort: 8.6%
- Average growth rate for all agencies: 3.5%
- Shared capabilities: What specialisms do these 74 agencies offer?
- Location: Where do these 74 agencies operate?
- Investment funding to Direct Marketing agencies by size
- Investment funding to all agencies by size
- Innovate UK funding to Direct Marketing agencies by size
- Innovate UK funding to all agencies by size
- Founder gender: Your cohort
- Founder gender: All agencies
Across the UK there are 74 agencies offering Direct Marketing services with a headcount of 11 to 50, with an average turnover of £2,995,582 and an average £130,473 turnover per head.
When it comes to size, agencies in this cohort sit in the established, mid-sized tier when compared to the nano agencies that make up six in ten of the total companies we have mapped. The turnover per head is almost exactly at the sector average of £129,856, as we published in our Agency by Agency Atlas 2026.
Key findings
- Agencies like yours are growing faster than the sector on average, and none are falling away sharply. The average growth of this cohort of agencies is 8.6%, well above the sector average of 3.5%. The distribution across the 74 agencies shows that 70.8% are stable, with 13.9% growing fast. According to our mapping, not one of the agencies mapped in this cohort is shrinking fast, compared to 3.0% across the sector as a whole.
- This is specialised, lightly bundled work. Across the 25,000 agencies we have mapped, it is normal for agencies to be mapped across a number of different specialisms. However, within this cohort, the most-shared additional capability (Website and UX/UI Design) is offered by just 5.4% of the cohort. Most agencies like yours present as focused Direct Marketing specialists.
- The cohort is less London-weighted than the sector as a whole. London hosts 28.4% of these agencies, below the sector-wide concentration of 41.9%.
- Leadership skews male, more so than the sector. 13.5% of the 74 agencies are women-led against 19.7% sector-wide, with 66.2% men-led and 20.3% mixed-led.
Agencies like yours: Our analysis
The data shows a cohort that is defined more by stability than by drama. Around a quarter of the cohort are growing meaningfully, while seven in ten hold steady. This means that momentum, in either direction, is concentrated in a minority rather than being spread out across the group. The thin capability overlap points to agencies competing on depth in Direct Marketing rather than breadth, and a notably different approach to the bundling of services and capabilities found elsewhere in the sector.
For leaders of agencies like yours, there are some interesting places you might look next:
- The growth ladder steepens just beyond this cohort’s ceiling, as agencies with a headcount of 51-100 averaging 18.7% growth across the sector as a whole.
- Public innovation funding is concentrated in agencies of your size. Indeed, almost half (47.2%) of all Innovate UK grant funding into the agency sector goes to agencies with a headcount of 11 to 50.
- Data and Analytics is a capability this cohort touches and one of the sector’s fastest growing specialisms. Within agencies like yours, it is a shared capability for 5.4% of the cohort and might represent adjacent headroom for Direct Marketing specialists.
- AI-adjacent capability is currently almost absent from the cohort and might be a space for differentiation.
- The cohort is maturing, with few recent entrants. This may raise questions about or opportunities for consolidation.
Our Agency Radar
The agency market moves quickly. Agencies grow, pivot, merge and disappear. A list that was accurate six months ago may already be out of date. Our agency radar means your acquisition pipeline, partner shortlist or outreach programme reflects the market as it is, and where it’s moving.
The Data
Company founding years: Your cohort
Company founding years
About the data
Our data on new agencies founded is based on company births and deaths, as registered with Companies House.
Company founding years: All agencies
Company founding years
About the data
Our data on new agencies founded is based on company births and deaths, as registered with Companies House.
Average growth rate for your cohort: 8.6%
Growth rates of UK agencies
About the data
Growth rates are provided by our partners at The Data City and are based on the annual headcount growth of any given agency we have mapped. Headcount growth is based on employee count data and turnover data, and to account for the lag in reporting, The Data City’s machine-learning platform can make an accurate best estimate. If an agency has less than three years reported data on employee number, no estimate is made and no growth data is reported. Growth rates for any given cohort or list of agencies is based on the growth rates of active agencies only.
Our ‘Growth Traffic Light’ breaks down the percentage of agencies in any given group that land in one of five growth rate categories: Shrinking fast (below -20% annual growth), Shrinking (-20% to -10% annual growth), Stable (-10% to 10% annual growth), Growing (10% to 20% annual growth) and Growing Fast (over 20% annual growth). If part of the chart is empty, this means that there were no agencies mapped in that particular interval.
Average growth rate for all agencies: 3.5%
Growth rates of UK agencies
About the data
Growth rates are provided by our partners at The Data City and are based on the annual headcount growth of any given agency we have mapped. Headcount growth is based on employee count data and turnover data, and to account for the lag in reporting, The Data City’s machine-learning platform can make an accurate best estimate. If an agency has less than three years reported data on employee number, no estimate is made and no growth data is reported. Growth rates for any given cohort or list of agencies is based on the growth rates of active agencies only.
Our ‘Growth Traffic Light’ breaks down the percentage of agencies in any given group that land in one of five growth rate categories: Shrinking fast (below -20% annual growth), Shrinking (-20% to -10% annual growth), Stable (-10% to 10% annual growth), Growing (10% to 20% annual growth) and Growing Fast (over 20% annual growth). If part of the chart is empty, this means that there were no agencies mapped in that particular interval.
Shared capabilities: What specialisms do these 74 agencies offer?
Agency share by specialism
About the data
We map the number of agencies in the UK agency sector together with our partners at The Data City, whose sophisticated machine-learning tool allows us to find and categorise active agencies after adjustment for dormant companies and those in liquidation or administration.
Depending on the individual agency and the services they offer, agencies can appear in more than one of our subsector or specialism lists.
Location: Where do these 74 agencies operate?
Agency share by cluster
About the data
We map the number of agencies in the UK agency sector together with our partners at The Data City, whose sophisticated machine-learning tool allows us to find and categorise active agencies after adjustment for dormant companies and those in liquidation or administration.
For the city distribution of agencies we are looking at the OECD-defined functional urban areas (FUA) or the UK. An FUA is composed of a core city and its commuting zones.
Our partners at The Data City provide us with this data for agencies based on registered company address.
Investment funding to Direct Marketing agencies by size
Investment funding share by headcount
About the data
Our partners at The Data City provide us with data on investment funding via Dealroom.
Data for employees / headcount is provided by our partners at The Data City based on reporting to Companies House. As there can be a lag in reporting, The Data City’s machine-learning platform can make an accurate best estimate. If an agency has less than three years reported data on employee number, no estimate is made and no data is reported.
Investment funding to all agencies by size
Investment funding share by headcount
About the data
Our partners at The Data City provide us with data on investment funding via Dealroom.
Data for employees / headcount is provided by our partners at The Data City based on reporting to Companies House. As there can be a lag in reporting, The Data City’s machine-learning platform can make an accurate best estimate. If an agency has less than three years reported data on employee number, no estimate is made and no data is reported.
Innovate UK funding to Direct Marketing agencies by size
Innovate UK funding share by headcount
About the data
Innovate UK grant funding data includes the total amount of grant funding to agencies we have mapped and the public descriptions of the successful funding bids.
Data for employees / headcount is provided by our partners at The Data City based on reporting to Companies House. As there can be a lag in reporting, The Data City’s machine-learning platform can make an accurate best estimate. If an agency has less than three years reported data on employee number, no estimate is made and no data is reported.
Innovate UK funding to all agencies by size
Innovate UK funding share by headcount
About the data
Innovate UK grant funding data includes the total amount of grant funding to agencies we have mapped and the public descriptions of the successful funding bids.
Data for employees / headcount is provided by our partners at The Data City based on reporting to Companies House. As there can be a lag in reporting, The Data City’s machine-learning platform can make an accurate best estimate. If an agency has less than three years reported data on employee number, no estimate is made and no data is reported.
Founder gender: Your cohort
Founder gender split
Founder gender: All agencies
Founder gender split
Photo by Ryan Booth on Unsplash
Latest articles and reports
View all
- Article
Transformation nation: What the data tells us about Digital and AI Transformation agencies
Our insight into Digital and AI Transformation agencies, drawing on the Agency by Agency Atlas 2026 and its supporting specialism data.
Read more
- Report
The South West: a smaller share of agencies, a bigger share of value
What makes the agency landscape in the South West distinctive?
Read more
- Article
The data on the data agencies: What makes Data and Analytics stand out
Our insight into Data and Analytics agencies we have mapped, drawing on the Agency by Agency Atlas 2026 and its supporting specialism data.
Read more