

Contents
- Not simply a stage. For many agencies, nano is the model
- The smallest of agencies are stable, and older than you might think
- What kind of work suits nano agencies?
- Where in the sector are women most likely to lead?
- Do nano agencies give the sector its national reach?
- So why do nano agencies matter to the sector?
Ask most people to describe an agency and they will probably picture a room full of people, if they are not imagining an episode of Mad Men. But one of the most striking findings from our mapping of the UK agency sector since we began about eighteen months ago, is the fact that two-thirds of the nearly 25,000 companies we have mapped are what we describe as “nano agencies”, part of the sector that up to now was pretty much overlooked by most other industry press and commentators.
By this we mean agencies with a headcount of just one or two people, and they employ 7.1% of the sector’s total workforce and generate 4.4% of turnover. They are also productive, and their contribution to the wider industry is not to be ignored. In this article we delve a little deeper into nano agencies to find out a little more.
Not simply a stage. For many agencies, nano is the model
Nano agencies might account for 67.0% of all active agencies that we have mapped in the UK, but they employ 7.1% of the workforce and generate 4.4% of turnover. Interestingly, they lead the sector when it comes to productivity when measured by gross value added. The average GVA per head of the nano agencies we have mapped is £99,736 and sits above the £94,452 sector average. This also means that the overall contribution of nano agencies to the UK economy is 8.0% of the total agency sector contribution, almost double their share of total turnover.
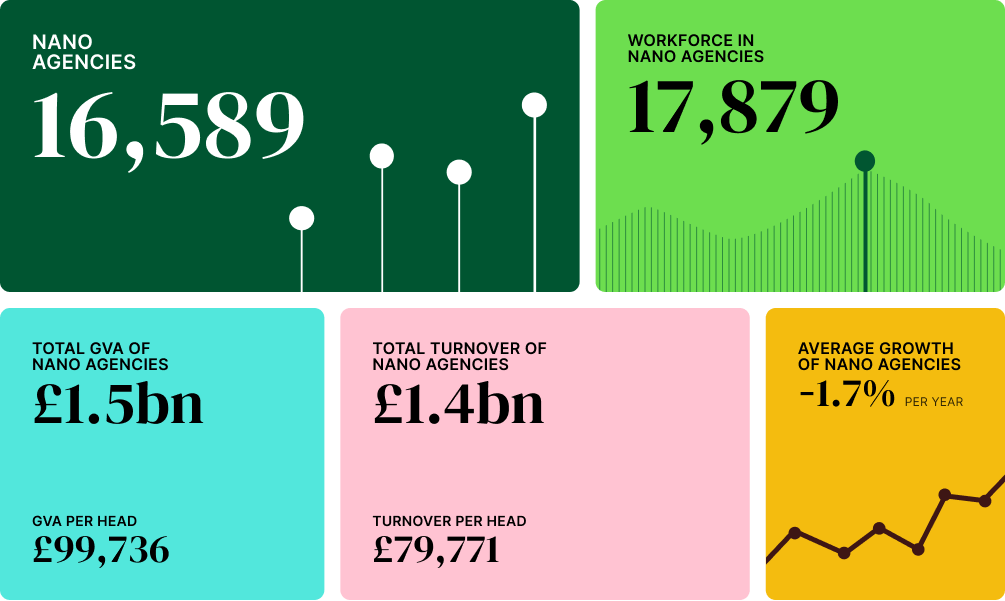
Unsurprisingly for a cohort of tiny companies, their growth rate (based on headcount and turnover, definition here) is basically non-existent, and of those that remain in the cohort (and have not grown out of it), they are actually, on average, shrinking. But as we will go on to explore this is fundamentally a stable cohort that has also proven to be extremely durable. When it comes to the type of work they do, nano agencies concentrate in craft- and execution-led specialisms, with Website and UX/UI Design being the most common. As we will also see, they are the most gender-balanced part of the sector and are more geographically spread than larger agencies.
The smallest of agencies are stable, and older than you might think
It might seem like a natural assumption that a one- or two-person agency is a young agency, one that will either grow out of this cohort or disappear. But our age data on nano agencies suggests something different. Indeed, nano agencies are distributed remarkably evenly across the age bands. Those up to five years old account for 20.1% of the cohort, six-to-ten-year-olds for 32.6%, eleven-to-fifteen-year-olds for 23.4% and agencies of sixteen years or more for 23.2%. Close to half have been operating for more than a decade. Certainly more than a phase!
Share of nano agencies by age
About the data
We map the number of agencies in the UK agency sector together with our partners at The Data City, whose sophisticated machine-learning tool allows us to find and categorise active agencies after adjustment for dormant companies and those in liquidation or administration.
Our data on agency age is based on company births and deaths, as registered with Companies House.
When it comes to growth, there is not much room for maneuver while staying within the nano agency cohort, which is why four in five agencies sit in the stable band of our growth traffic light.
Growth traffic light for nano agencies
About the data
Growth rates are provided by our partners at The Data City and are based on the annual headcount growth of any given agency we have mapped. Headcount growth is based on employee count data and turnover data, and to account for the lag in reporting, The Data City’s machine-learning platform can make an accurate best estimate. If an agency has less than three years reported data on employee number, no estimate is made and no growth data is reported. Growth rates for any given cohort or list of agencies is based on the growth rates of active agencies only.
Our ‘Growth Traffic Light’ breaks down the percentage of agencies in any given group that land in one of five growth rate categories: Shrinking fast (below -20% annual growth), Shrinking (-20% to -10% annual growth), Stable (-10% to 10% annual growth), Growing (10% to 20% annual growth) and Growing Fast (over 20% annual growth). If part of the chart is empty, this means that there were no agencies mapped in that particular interval.
There is a bit more detail to be found when we look at the growth rates of nano agencies by age. There we can see that it is the youngest agencies that are the most likely to be stable while the oldest are the most exposed to decline. Nevertheless, this remains a cohort with a high proportion of long-standing and predominantly stable agencies, for whom being a nano agency is more likely to be a choice or a destination, rather than a stage in the agency life cycle.
Growth traffic light for nano agencies by age
About the data
Growth rates are provided by our partners at The Data City and are based on the annual headcount growth of any given agency we have mapped. Headcount growth is based on employee count data and turnover data, and to account for the lag in reporting, The Data City’s machine-learning platform can make an accurate best estimate. If an agency has less than three years reported data on employee number, no estimate is made and no growth data is reported. Growth rates for any given cohort or list of agencies is based on the growth rates of active agencies only.
Our ‘Growth Traffic Light’ breaks down the percentage of agencies in any given group that land in one of five growth rate categories: Shrinking fast (below -20% annual growth), Shrinking (-20% to -10% annual growth), Stable (-10% to 10% annual growth), Growing (10% to 20% annual growth) and Growing Fast (over 20% annual growth). If part of the chart is empty, this means that there were no agencies mapped in that particular interval.
Our data on agency age is based on company births and deaths, as registered with Companies House.
What kind of work suits nano agencies?
The specialisms nano agencies offer tell us a great deal about what is, and is not, possible with a headcount of one or two. Our mapping and analysis of the nano agency cohort suggests that this work is concentrated in the crafts that a very small team can deliver end to end.
Website and UX/UI Design is the most common specialism, offered by 36.4% of nano agencies, ahead of the sector-wide figure of 33.3%. Digital (20.2%), Design and Branding (19.1%), SEO (11.3%) and PR and Communications (9.4%) follow, alongside a strong showing for Video and Production (8.3%) and Copywriting (2.3%).
Share of nano agencies by specialism
About the data
We map the number of agencies in the UK agency sector together with our partners at The Data City, whose sophisticated machine-learning tool allows us to find and categorise active agencies after adjustment for dormant companies and those in liquidation or administration.
Depending on the individual agency and the services they offer, agencies can appear in more than one of our subsector or specialism lists.
Where in the sector are women most likely to lead?
Across the agency sector, women are under-represented in leadership, and the gap between founding and leading is one of the most consistent findings in our mapping. Nano agencies do not close that gap, but they come closer than any other part of the sector we have examined.
Among nano agencies, 22.7% are women-founded, 21.5% are women-led and 33.9% of all directors are women. Each of these figures sits above the sector-wide data, where 21.0% of agencies are women-founded, 19.7% are women-led and 32.2% of directors are women. If we look at all agencies excluding nano agencies, the gap is still wider. For agencies with a headcount of three and over, 17.0% are women-founded, 16.2% are women-led and 30.0% of agency directors are women.
Founder gender for nano agencies
Do nano agencies give the sector its national reach?
Geography offers a clue to the importance of nano agencies beyond their economic weight. They are more evenly spread across the UK than larger agencies.
London is home to 41.3% of nano agencies, a substantial concentration but a notably lower one than, for example, agencies with more than 100 employees. In this cohort, 80.4% of agencies are located in the capital. Beyond London, nano agencies are found across Manchester (5.4%), Leeds (3.9%), Birmingham and Wolverhampton (3.1%), and a long list of smaller clusters including Brighton and Hove, Bristol, Glasgow, Liverpool and Edinburgh.
Share of nano agencies by city cluster
About the data
We map the number of agencies in the UK agency sector together with our partners at The Data City, whose sophisticated machine-learning tool allows us to find and categorise active agencies after adjustment for dormant companies and those in liquidation or administration.
For the city distribution of agencies we are looking at the OECD-defined functional urban areas (FUA) or the UK. An FUA is composed of a core city and its commuting zones.
Our partners at The Data City provide us with this data for agencies based on registered company address.
The difference between nano agencies and the rest of the sector becomes even more pronounced when we look at the workforce data. Within the nano agency cohort, 44.2% of the workforce can be found in London. Across the agency sector as a whole, the Agency by Agency Atlas 2026 shows that 55.4% of the total workforce is based in the capital.
Nano agency workforce by city cluster
About the data
Data for employees / headcount is provided by our partners at The Data City based on reporting to Companies House. As there can be a lag in reporting, The Data City’s machine-learning platform can make an accurate best estimate. If an agency has less than three years reported data on employee number, no estimate is made and no data is reported.
For the city distribution of agencies we are looking at the OECD-defined functional urban areas (FUA) or the UK. An FUA is composed of a core city and its commuting zones.
Our partners at The Data City provide us with this data for agencies based on registered company address.
So why do nano agencies matter to the sector?
It would be easy, reading only the turnover and workforce figures, to treat nano agencies as a rounding error. They might well be two-thirds of the sector by number, but a small fraction of it by the measures that usually command attention. But perhaps the data we present here suggests some different conclusions.
Nano agencies are important, not least because they are a fundamental building block of the sector as we know it. Anyone speaking about “agencies” that does not account for the fact that two-thirds of them are companies of one or two people is potentially describing the minority and calling it the whole. Nano agencies are also important because of their value to the economy. When measured by GVA per head, they outperform the rest of the sector.
So is the future value of agency work to be found in collectives of nano agencies, coming together to deliver specific projects, but always maintaining their autonomy and agility? More research is needed, but anecdotally it feels like many of these nano agencies are run by highly experienced professionals who add strategic value in addition to executional experience, and in a world of increasing fragmentation there is a possibility that future clients will commission ecosystems of specialists who come together to solve very specific strategic problems.
It is also interesting to note that, while still far from equal, nano agencies tend to be more inclusive when it comes to gender. The durability of nano agencies, and the fact that for a good proportion of them they are a destination rather than a staging post, perhaps offers some clues as to why being a nano agency through choice might also influence the data when it comes to gender, but also the type of work these agencies do.
Bespoke agency intelligence
Searching for an agency? Whether for a pitch, a partnership, an acquisition or a market entry, finding the right agency requires knowing who is out there, what they actually do, how they are performing and whether they match what you need.
Our agency directory is the only comprehensive list of UK agencies enriched with data on capabilities and specialisms, growth signals and other performance indicators. We use it to deliver intelligence in the three ways; as a one-off curated dataset, as an ongoing agency radar, or as part of a broader advisory relationship.
Photo by freddie marriage on Unsplash
Latest articles and reports
View all
- Report
High growth agencies: what sets the sector’s fastest risers apart?
Our latest report takes a more detailed look at agencies with an average growth rate of over 20%
Read more
- Article
Transformation nation: What the data tells us about Digital and AI Transformation agencies
Our insight into Digital and AI Transformation agencies, drawing on the Agency by Agency Atlas 2026 and its supporting specialism data.
Read more
- Report
The South West: a smaller share of agencies, a bigger share of value
What makes the agency landscape in the South West distinctive?
Read more