
Contents
- Executive summary
- Mapping the UK Agency Sector
- Agency size
- The size of agencies
- How agency size matters
- Growth
- New agencies founded
- Growth across the sector
- Growth in different sizes of agency
- Exploring the agency subsectors
- Subsector data
- Subsector growth rates
- Growth and competitive niches
- Independents and the Big Seven
- Regional distribution and agency clusters
- London and outside London comparison
- Agency subsector clusters
- Women in the agency sector
- Investment and Innovation Funding
- Investment and agency subsectors
- Innovate UK grant funding and agency subsectors
The first comprehensive mapping, data and insight into the UK’s marketing, advertising, creative and media agencies, published by Agency by Agency with commentary from voices from across the sector.
The UK agency sector is one of this country’s most precious assets and one of growing influence and economic impact. Until now, it has been difficult to fully celebrate the value, diversity and creativity of the sector because it had not been mapped in detail. We are incredibly proud to launch Agency by Agency with our first Industry Report, built on sophisticated technology, years of agency experience and the insight and expertise of our colleagues from across the industry.
Unless we know where we stand, it is impossible to move forward…
“This new analysis provides industry insight that we’ve never had in such detail before. It not only sheds light on the make-up of the agency sector but also offers valuable data for agencies to benchmark their performance and identify areas for growth.”
Jason Neale / Managing Director, Agency Works
Executive summary
Agency by Agency was founded in order to answer some of the key questions for stakeholders in the agency sector. How big is it anyway? How many agencies are there? What types of agencies exist and what services do they offer? Where is the growth in the sector? What is the impact of the sector on the wider economy?
Thanks to our unique mapping of the agency sector, developed alongside our partners at The Data City, we can begin to answer these questions and solve the problem of the lack of accurate and informative data and insight to help those in our sector make the right decisions.
- The agency sector is bigger than before thought and has a substantial impact on the UK economy
- This success is built on different types of agencies that all make a significant contribution to the sector, from small and large agencies, to independents and those belonging to multinational holding companies
- The number of agencies continues to rise and the sector shows overall growth, but growth is not uniform, with significant variation depending on agency size or subsector
- Our new and comprehensive mapping of the sector allows us to explore trends across 28 different agency subsectors, from agency size and location, to growth and key financial indicators
- London is important but the agency sector is not as concentrated on the capital as it might sometimes seem, especially within certain agency subsectors
- Women make up about a third of all agency directors, with marked variance depending on the subsector and the services agencies offer
- Investment and Innovate UK grant funding data suggests money is flowing into the sector, but not uniformly across all types of agency
Our first Agency by Agency Industry Report is just the beginning. The Spring 2025 edition offers the most comprehensive overview of the UK agency sector ever published, but like any good journey, this exciting start suggests there is more to come.
Mapping the UK Agency Sector
Together with our partners The Data City, we have developed the most comprehensive mapping of the UK’s marketing, advertising, creative and media agency sector ever before seen. We have identified more than 30,000 individual agencies operating across 28 different subsectors, which have become the basis for our Data Shots – benchmarking data and insight available exclusively to Agency by Agency subscribers.
Having adjusted the dataset to account for dormant companies and those in administration or liquidation we can show that there are at least 25,495 agencies active in our sector.
These agencies:
- Employ 265,000 people
- Have a total turnover of £34.9bn
- Contribute £20.5bn in Gross Value Added (GVA) to the UK economy
- Have a GVA per agency employee of £77,438
About the data
We map the number of agencies in the UK agency sector together with our partners at The Data City, whose sophisticated machine-learning tool allows us to find and categorise active agencies after adjustment for dormant companies and those in liquidation or administration.
Data for employees / headcount is provided by our partners at The Data City based on reporting to Companies House. As there can be a lag in reporting, The Data City’s machine-learning platform can make an accurate best estimate. If an agency has less than three years reported data on employee number, no estimate is made and no data is reported.
Data for turnover is provided by our partners at The Data City based on financial reporting to Companies House. As there can be a lag in financial reporting, The Data City uses sophisticated modelling to provide estimated turnover for the current year’s values. Where this is impossible, no data is reported.
Naturally, turnover should be treated carefully. Some types of agency, such as media, are more likely to include media billings and other campaign costs in the turnover figure they submit at Companies House. Our roadmap includes the development of benchmarking metrics to overcome this including revenue per head, gross profit and net asset value.
GVA stands for ‘Gross Value Added’ and our GVA data is provided by our partners at The Data City and is estimated at the company level using official GVA (as defined by ONS) and employment data.
“This unique data set from Agency by Agency demonstrates just how critical agencies are to the UK creative industries. At last we can shine a detailed light on the industry as a whole and see 25,000 UK agencies generating 35bn of turnover and employing over 250,000 people. The report also highlights some of the challenges around scaling agencies and where opportunities exist to provide investment and support.”
Paul Mead / Chair of We Discover, Beacon lead at the Institute of Practitioners in Advertising
Agency size
When does an agency become an agency? We explore the agencies we have mapped in a number of different ways including size. In turn, we measure the size of an agency based on both headcount – the number of employees – and turnover. Although there is often correlation between the two ways of exploring the data based on size, it is of course not always the case that the higher the number of employees, the higher the turnover.
Indeed, the lack of an agreed threshold as to when an agency becomes an agency may become even more complex in the era of fast AI adoption, fractional working and freelancing across the sector. It may be that the number of employees ceases to be a determining factor in agency growth.
The size of agencies
When looking at active agencies in the UK sector, it is clear that an extremely large proportion of the overall number are small or micro agencies. Agencies with 1-2 employees account for 62.7% of the total number of agencies. Agencies with 10 or less employees account for 85.3% of the sector.
When measuring the size of an agency by turnover, similar patterns emerge. Of all 25,495 agencies in the sector as a whole, 84.4% have a turnover of £500,000 or less. When looking at the number of agencies, the column marked ‘No data’ refers to the agencies for which there is currently no data in our mapping – usually this is because an agency is too young to have reported their employee data, or there is not enough previous data from which to make a best estimate.
Total number of agencies by size (headcount)
About the data
We map the number of agencies in the UK agency sector together with our partners at The Data City, whose sophisticated machine-learning tool allows us to find and categorise active agencies after adjustment for dormant companies and those in liquidation or administration.
Data for employees / headcount is provided by our partners at The Data City based on reporting to Companies House. As there can be a lag in reporting, The Data City’s machine-learning platform can make an accurate best estimate. If an agency has less than three years reported data on employee number, no estimate is made and no data is reported.
If part of the chart is empty, this means that there were no agencies mapped in that particular interval.
UK agency sizes (headcount)
About the data
We map the number of agencies in the UK agency sector together with our partners at The Data City, whose sophisticated machine-learning tool allows us to find and categorise active agencies after adjustment for dormant companies and those in liquidation or administration.
Data for employees / headcount is provided by our partners at The Data City based on reporting to Companies House. As there can be a lag in reporting, The Data City’s machine-learning platform can make an accurate best estimate. If an agency has less than three years reported data on employee number, no estimate is made and no data is reported.
Total number of agencies by size (turnover)
About the data
We map the number of agencies in the UK agency sector together with our partners at The Data City, whose sophisticated machine-learning tool allows us to find and categorise active agencies after adjustment for dormant companies and those in liquidation or administration.
Data for turnover is provided by our partners at The Data City based on financial reporting to Companies House. As there can be a lag in financial reporting, The Data City uses sophisticated modelling to provide estimated turnover for the current year’s values. Where this is impossible, no data is reported.
If part of the chart is empty, this means that there were no agencies mapped in that particular interval.
UK agency sizes (turnover)
About the data
We map the number of agencies in the UK agency sector together with our partners at The Data City, whose sophisticated machine-learning tool allows us to find and categorise active agencies after adjustment for dormant companies and those in liquidation or administration.
Data for turnover is provided by our partners at The Data City based on financial reporting to Companies House. As there can be a lag in financial reporting, The Data City uses sophisticated modelling to provide estimated turnover for the current year’s values. Where this is impossible, no data is reported.
Naturally, turnover should be treated carefully. Some types of agency, such as media, are more likely to include media billings and other campaign costs in the turnover figure they submit at Companies House. Our roadmap includes the development of benchmarking metrics to overcome this including revenue per head, gross profit and net asset value.
“We always knew instinctively the agency sector was built on small, independent businesses, but seeing the hard data behind this should give founders of these smaller businesses confidence in their legitimacy and place in the industry.”
Claire Hutchings / Founder & MD Chime Agency
How agency size matters
When looking at the agency numbers, the majority of agencies are either micro or small companies, whether we measure size by headcount or turnover. At the same time, comparing the share of the number of companies with the share of total employees and total turnover allows us to better assess the impact of different sizes of agency across the sector.
The high number of 1-2 person agencies means that together they contribute £1.3bn GVA to the UK economy, while the 198 agencies employing between 101-250 people contribute 2.3bn. Small agencies and freelancers matter.
Nevertheless, big agencies have a big influence. Agencies with more than 50 employees make up only 3.4% of total agencies but account for 62.3% of all employees in the sector and are responsible for 79.9% of total turnover.
Agencies with £3 million turnover or more account for 4.2% of total agencies, account for 62.6% of all employees and are responsible for 86.1% of total turnover.
| Agency headcount | No of agencies | % of all agencies | No of employees | % of all employees | Total turnover | % of total turnover | Average turnover |
|---|---|---|---|---|---|---|---|
| 1-2 | 13,866 | 63% | 18,595 | 7% | £1.0Bn | 3% | £0.1M |
| 3-10 | 4,983 | 23% | 26,072 | 10% | £1.5Bn | 4% | £0.3M |
| 11-20 | 1,398 | 6% | 20,403 | 8% | £1.3Bn | 4% | £0.9M |
| 21-50 | 1,098 | 5% | 34,731 | 13% | £3.1Bn | 9% | £2.8M |
| 51-100 | 388 | 2% | 27,565 | 10% | £3.8Bn | 11% | £9.7M |
| 101-250 | 198 | 1% | 29,929 | 11% | £7.2Bn | 21% | £33.9M |
| 251+ | 163 | 1% | 107,213 | 41% | £16.7Bn | 48% | £102.7M |
About the data
We map the number of agencies in the UK agency sector together with our partners at The Data City, whose sophisticated machine-learning tool allows us to find and categorise active agencies after adjustment for dormant companies and those in liquidation or administration.
Data for employees / headcount is provided by our partners at The Data City based on reporting to Companies House. As there can be a lag in reporting, The Data City’s machine-learning platform can make an accurate best estimate. If an agency has less than three years reported data on employee number, no estimate is made and no data is reported.
Data for turnover is provided by our partners at The Data City based on financial reporting to Companies House. As there can be a lag in financial reporting, The Data City uses sophisticated modelling to provide estimated turnover for the current year’s values. Where this is impossible, no data is reported.
Naturally, turnover should be treated carefully. Some types of agency, such as media, are more likely to include media billings and other campaign costs in the turnover figure they submit at Companies House. Our roadmap includes the development of benchmarking metrics to overcome this including revenue per head, gross profit and net asset value.
| Agency turnover | No of agencies | % of all agencies | No of employees | % of all employees | Total turnover | % of total turnover |
|---|---|---|---|---|---|---|
| Up to £500k | 18,873 | 84% | 46,957 | 18% | £2.0Bn | 6% |
| £500k to £1m | 1,458 | 7% | 20,150 | 8% | £1.0Bn | 3% |
| £1m to £3m | 1,092 | 5% | 31,287 | 12% | £1.8Bn | 5% |
| £3m to £10m | 421 | 2% | 24,852 | 9% | £2.2Bn | 6% |
| £10m to £50m | 351 | 2% | 48,734 | 19% | £7.4Bn | 21% |
| £50m+ | 158 | 1% | 91,283 | 35% | £20.5Bn | 59% |
About the data
We map the number of agencies in the UK agency sector together with our partners at The Data City, whose sophisticated machine-learning tool allows us to find and categorise active agencies after adjustment for dormant companies and those in liquidation or administration.
Data for employees / headcount is provided by our partners at The Data City based on reporting to Companies House. As there can be a lag in reporting, The Data City’s machine-learning platform can make an accurate best estimate. If an agency has less than three years reported data on employee number, no estimate is made and no data is reported.
Data for turnover is provided by our partners at The Data City based on financial reporting to Companies House. As there can be a lag in financial reporting, The Data City uses sophisticated modelling to provide estimated turnover for the current year’s values. Where this is impossible, no data is reported.
Naturally, turnover should be treated carefully. Some types of agency, such as media, are more likely to include media billings and other campaign costs in the turnover figure they submit at Companies House. Our roadmap includes the development of benchmarking metrics to overcome this including revenue per head, gross profit and net asset value.
When defining an agency’s size based on headcount, we can see that the largest agencies employ the greatest proportion of people within the sector. Indeed, more than four-in-ten of all sector employees work for 251+ person agencies.
of all agency employees work in 251+ person agencies
About the data
We map the number of agencies in the UK agency sector together with our partners at The Data City, whose sophisticated machine-learning tool allows us to find and categorise active agencies after adjustment for dormant companies and those in liquidation or administration.
Data for employees / headcount is provided by our partners at The Data City based on reporting to Companies House. As there can be a lag in reporting, The Data City’s machine-learning platform can make an accurate best estimate. If an agency has less than three years reported data on employee number, no estimate is made and no data is reported.
We see similar results when defining an agency’s size by turnover. Here we can see that agencies with a turnover of over £50m – a total of 158 agencies mapped – are responsible for 59% of the total turnover of all agencies.
158 large agencies (£50m+ turnover) are responsible for 59% of the total turnover of all agencies.
About the data
We map the number of agencies in the UK agency sector together with our partners at The Data City, whose sophisticated machine-learning tool allows us to find and categorise active agencies after adjustment for dormant companies and those in liquidation or administration.
Data for turnover is provided by our partners at The Data City based on financial reporting to Companies House. As there can be a lag in financial reporting, The Data City uses sophisticated modelling to provide estimated turnover for the current year’s values. Where this is impossible, no data is reported.
Naturally, turnover should be treated carefully. Some types of agency, such as media, are more likely to include media billings and other campaign costs in the turnover figure they submit at Companies House. Our roadmap includes the development of benchmarking metrics to overcome this including revenue per head, gross profit and net asset value.
The impact of larger agencies can be clearly seen in the total GVA by agency size (headcount). Agencies with 251+ employees contribute £9bn in GVA to the UK economy.
Total estimated GVA by agency size (headcount)
About the data
GVA stands for ‘Gross Value Added’ and our GVA data is provided by our partners at The Data City and is estimated at the company level using official GVA (as defined by ONS) and employment data.
Data for employees / headcount is provided by our partners at The Data City based on reporting to Companies House. As there can be a lag in reporting, The Data City’s machine-learning platform can make an accurate best estimate. If an agency has less than three years reported data on employee number, no estimate is made and no data is reported.
Whether we measure size of agency by turnover or the number of employees (headcount), we can see that turnover-per-head increases as agencies get bigger, except for the largest of agencies.
Turnover-per-head by size of agency (headcount)
About the data
Turnover-per-head is calculated using total turnover and total number of employees. Data for turnover is provided by our partners at The Data City based on financial reporting to Companies House. As there can be a lag in financial reporting, The Data City uses sophisticated modelling to provide estimated turnover for the current year’s values. Where this is impossible, no data is reported.
Naturally, turnover should be treated carefully. Some types of agency, such as media, are more likely to include media billings and other campaign costs in the turnover figure they submit at Companies House. Our roadmap includes the development of benchmarking metrics to overcome this including revenue per head, gross profit and net asset value.
Data for employees / headcount is provided by our partners at The Data City based on reporting to Companies House. As there can be a lag in reporting, The Data City’s machine-learning platform can make an accurate best estimate. If an agency has less than three years reported data on employee number, no estimate is made and no data is reported.
Turnover-per-head by size of agency (turnover)
About the data
Turnover-per-head is calculated using total turnover and total number of employees. Data for turnover is provided by our partners at The Data City based on financial reporting to Companies House. As there can be a lag in financial reporting, The Data City uses sophisticated modelling to provide estimated turnover for the current year’s values. Where this is impossible, no data is reported.
Naturally, turnover should be treated carefully. Some types of agency, such as media, are more likely to include media billings and other campaign costs in the turnover figure they submit at Companies House. Our roadmap includes the development of benchmarking metrics to overcome this including revenue per head, gross profit and net asset value.
Data for employees / headcount is provided by our partners at The Data City based on reporting to Companies House. As there can be a lag in reporting, The Data City’s machine-learning platform can make an accurate best estimate. If an agency has less than three years reported data on employee number, no estimate is made and no data is reported.
Growth
As a whole, the number of new agencies continues to increase year on year, and the sector is also showing steady growth when it comes to overall headcount and turnover. But as always, the detail suggests a story that is nuanced and with variations across the agency sector.
New agencies founded
The total number of agencies continues to rise, but the rate of new agencies being founded has slowed since a peak in 2019. This dramatic growth in the 2010s, and slowdown in the 2020s, is one of the most significant findings, and has never been visible before. Our mapping suggests that the total number of agencies in the UK almost doubled between 2015 and 2024.
There are interesting variations within this too. Some specialisms are still experiencing year on year growth in the number of agencies being established to service them, and these patterns relate directly to emerging channels, client-side demand, technology and consumer behaviour.
“The fact Agency by Agency’s data shows a slowdown in new agencies’ founding probably reflects that we have reached saturation point in the sector, which has been felt anecdotally in the last 24-months. The next few years, with advancements in AI, off-shoring and in-housing, will likely need to see a consolidation across the industry. However, with larger entities generating more turnover per head, this should be seen as an opportunity for smaller agencies to join forces.”
Claire Hutchings / Founder & MD Chime Agency
New agencies founded
About the data
We map the number of agencies in the UK agency sector together with our partners at The Data City, whose sophisticated machine-learning tool allows us to find and categorise active agencies after adjustment for dormant companies and those in liquidation or administration.
Our data on new agencies founded is based on company births and deaths, as registered with Companies House.
Growth across the sector
The annual growth rate of the agency sector as a whole (calculated based on headcount and turnover) is 7.3%.
“This fascinating study unveils the dynamics of the industry landscape. While large agencies dominate in employment and turnover, independent agencies remain its backbone. The high annual growth rate of over 7% which is impressive in the current climate will be in part driven by the independent sector and therefore reinforces the idea that the industry offers a wealth of choice when it comes to agencies, ensuring diversity and competition is buoyant for the foreseeable future.”
Dominic Greary / Founder & Managing Director 1671
About the data
Growth rates are provided by our partners at The Data City and are based on the annual headcount and turnover growth of any given agency we have mapped. Employee count data is more common than turnover data, and to account for the lag in reporting, The Data City’s machine-learning platform can make an accurate best estimate. If an agency has less than three years reported data on employee number, no estimate is made and no growth data is reported.
The majority of agencies mapped are classed as stable, with growth annual rates between -10% and +10%. Our analysis reveals where the most growth and contraction is in the sector.
Growth rates of UK agencies
About the data
Growth rates are provided by our partners at The Data City and are based on the annual headcount and turnover growth of any given agency we have mapped. Employee count data is more common than turnover data, and to account for the lag in reporting, The Data City’s machine-learning platform can make an accurate best estimate. If an agency has less than three years reported data on employee number, no estimate is made and no growth data is reported.
Our ‘Growth Traffic Light’ breaks down the percentage of agencies in any given group that land in one of five growth rate categories: Shrinking fast (below -20% annual growth), Shrinking (-20% to -10% annual growth), Stable (-10% to 10% annual growth), Growing (10% to 20% annual growth) and Growing Fast (over 20% annual growth). If part of the chart is empty, this means that there were no agencies mapped in that particular interval.
Growth in different sizes of agency
From the following charts we can see that the groupings of larger agencies, whether measured by turnover or headcount, are showing growth above the sector average of 7.3%. In both agencies by size (turnover) and agencies by size (headcount), the largest agencies have the highest growth rate, with 251+ person agencies showing a growth rate of 11% and £50m+ agencies a growth rate of 10%.
Growth rates of agencies by size (turnover)
About the data
Growth rates are provided by our partners at The Data City and are based on the annual headcount and turnover growth of any given agency we have mapped. Employee count data is more common than turnover data, and to account for the lag in reporting, The Data City’s machine-learning platform can make an accurate best estimate. If an agency has less than three years reported data on employee number, no estimate is made and no growth data is reported.
Data for turnover is provided by our partners at The Data City based on financial reporting to Companies House. As there can be a lag in financial reporting, The Data City uses sophisticated modelling to provide estimated turnover for the current year’s values. Where this is impossible, no data is reported.
Growth rates of agencies by size (headcount)
About the data
Growth rates are provided by our partners at The Data City and are based on the annual headcount and turnover growth of any given agency we have mapped. Employee count data is more common than turnover data, and to account for the lag in reporting, The Data City’s machine-learning platform can make an accurate best estimate. If an agency has less than three years reported data on employee number, no estimate is made and no growth data is reported.
Data for employees / headcount is provided by our partners at The Data City based on reporting to Companies House. As there can be a lag in reporting, The Data City’s machine-learning platform can make an accurate best estimate. If an agency has less than three years reported data on employee number, no estimate is made and no data is reported.
For any given group of agencies, whether by size or subsector (see below), the overall growth rate of a group will always represent general trends and not necessarily speak to the experience of individual agencies or the nuance and variation within a grouping. With our ‘Growth Traffic Lights’ we can see the percentage of any given collection of agencies that are growing, stable or contracting.
For example, although the £1m to £3m size agencies (by turnover) are showing an overall growth rate of 8%, we can see that nearly half of these agencies are either growing (10% to 20%) or growing fast (more than 20%).
Growth rates for agencies of different sizes (turnover)
About the data
Growth rates are provided by our partners at The Data City and are based on the annual headcount and turnover growth of any given agency we have mapped. Employee count data is more common than turnover data, and to account for the lag in reporting, The Data City’s machine-learning platform can make an accurate best estimate. If an agency has less than three years reported data on employee number, no estimate is made and no growth data is reported.
Our ‘Growth Traffic Light’ breaks down the percentage of agencies in any given group that land in one of five growth rate categories: Shrinking fast (below -20% annual growth), Shrinking (-20% to -10% annual growth), Stable (-10% to 10% annual growth), Growing (10% to 20% annual growth) and Growing Fast (over 20% annual growth). If part of the chart is empty, this means that there were no agencies mapped in that particular interval.
Data for turnover is provided by our partners at The Data City based on financial reporting to Companies House. As there can be a lag in financial reporting, The Data City uses sophisticated modelling to provide estimated turnover for the current year’s values. Where this is impossible, no data is reported.
Growth rates for agencies of different sizes (headcount)
About the data
Growth rates are provided by our partners at The Data City and are based on the annual headcount and turnover growth of any given agency we have mapped. Employee count data is more common than turnover data, and to account for the lag in reporting, The Data City’s machine-learning platform can make an accurate best estimate. If an agency has less than three years reported data on employee number, no estimate is made and no growth data is reported.
Our ‘Growth Traffic Light’ breaks down the percentage of agencies in any given group that land in one of five growth rate categories: Shrinking fast (below -20% annual growth), Shrinking (-20% to -10% annual growth), Stable (-10% to 10% annual growth), Growing (10% to 20% annual growth) and Growing Fast (over 20% annual growth). If part of the chart is empty, this means that there were no agencies mapped in that particular interval.
Data for employees / headcount is provided by our partners at The Data City based on reporting to Companies House. As there can be a lag in reporting, The Data City’s machine-learning platform can make an accurate best estimate. If an agency has less than three years reported data on employee number, no estimate is made and no data is reported.
“A brilliant ‘never been done before’ data set that puts the spotlight firmly onto the key levers of growth for the whole agency industry. The robustness of the data, given the breadth of all types of agencies involved, makes this very powerful. It will be enlightening for agencies to actively track and use the key data points that really matter.”
Emma Hillary / Growth Director, Verity Relationship Intelligence
Exploring the agency subsectors
Agency by Agency currently maps the sector by offering insight and Data Shots (benchmarking and subsector analysis) into 28 subsectors based on the services agencies offer. It is always important to remember when exploring this data that depending on what an agency does, it can appear in more than one of these subsector lists.
Number of agencies in each subsector
About the data
We map the number of agencies in the UK agency sector together with our partners at The Data City, whose sophisticated machine-learning tool allows us to find and categorise active agencies after adjustment for dormant companies and those in liquidation or administration. Depending on the individual agency and the services they offer, agencies can appear in more than one of our subsector lists.
“Everything is digital. The data is compelling to show that describing yourself as a digital agency would appear to be even more ambiguous than ‘full service’. With this level of competition, fitting in won’t help agencies stand out. Agency leaders should gain clarity about their service and sector offering to weather the market. For example, it is interesting to see the sub-sector opportunities outlined in the data. With Influencer and Amazon/Marketplace agencies a scarcity, but growing fast, more established agencies should look to build strong partnerships here to bolster their offerings.”
Claire Hutchings / Founder & MD Chime Agency
The number of individual agencies in any given subsector only tells part of the story, as some subsectors have a greater proportion of small agencies (by headcount or turnover). The subsectors with largest cumulative share of employees and total turnover are:
Share of total employees
| Digital: | 17.84% of all employees | (21.63% of total agencies) |
| Digital transformation: | 13.14% of all employees | (2.95% of total agencies) |
| Creative and advertising: | 12.83% of all employees | (2.90% of total agencies) |
| Website and UX/UI design: | 11.77% of all employees | (32.96% of total agencies) |
| Search and performance: | 11.63% of all employees | (6.43% of total agencies) |
About the data
We map the number of agencies in the UK agency sector together with our partners at The Data City, whose sophisticated machine-learning tool allows us to find and categorise active agencies after adjustment for dormant companies and those in liquidation or administration. Depending on the individual agency and the services they offer, agencies can appear in more than one of our subsector lists.
Data for employees / headcount is provided by our partners at The Data City based on reporting to Companies House. As there can be a lag in reporting, The Data City’s machine-learning platform can make an accurate best estimate. If an agency has less than three years reported data on employee number, no estimate is made and no data is reported.
Share of total turnover:
| Media: | 23.80% of total turnover | (2.34% of total agencies) |
| Creative and advertising: | 17.75% of total turnover | (2.90% of total agencies) |
| Digital transformation: | 11.99% of total turnover | (2.95% of total agencies) |
| Digital: | 11.15% of total turnover | (21.63% of total agencies) |
| Integrated and full service: | 11.15% of total turnover | (9.12% of total agencies) |
About the data
We map the number of agencies in the UK agency sector together with our partners at The Data City, whose sophisticated machine-learning tool allows us to find and categorise active agencies after adjustment for dormant companies and those in liquidation or administration. Depending on the individual agency and the services they offer, agencies can appear in more than one of our subsector lists.
Data for turnover is provided by our partners at The Data City based on financial reporting to Companies House. As there can be a lag in financial reporting, The Data City uses sophisticated modelling to provide estimated turnover for the current year’s values. Where this is impossible, no data is reported.
Naturally, turnover should be treated carefully. Some types of agency, such as media, are more likely to include media billings and other campaign costs in the turnover figure they submit at Companies House. Our roadmap includes the development of benchmarking metrics to overcome this including revenue per head, gross profit and net asset value.
Subsector data
In each of our 28 Data Shots, you can explore key stats and financials for the different agency subsectors, including number of agencies, new agencies founded, average turnover, turnover-per-head, headcount, GVA, investment funding and more.
We recognise that as a point of comparison across subsectors, turnover and turnover-per-head should be treated very carefully. Some types of agency, such as media in the list above and below, are more likely to include media billings and other campaign costs in the turnover they submit to Companies House.
We are working with our partners at The Data City ahead of our future data updates – planned for June, September and December in 2025 – to develop benchmarking metrics to overcome this limitation in the data, such as revenue-per-head, gross profit and net asset value.
Turnover-per-head by subsector
About the data
We map the number of agencies in the UK agency sector together with our partners at The Data City, whose sophisticated machine-learning tool allows us to find and categorise active agencies after adjustment for dormant companies and those in liquidation or administration. Depending on the individual agency and the services they offer, agencies can appear in more than one of our subsector lists.
Turnover-per-head is calculated using total turnover and total number of employees. Data for turnover is provided by our partners at The Data City based on financial reporting to Companies House. As there can be a lag in financial reporting, The Data City uses sophisticated modelling to provide estimated turnover for the current year’s values. Where this is impossible, no data is reported.
Naturally, turnover should be treated carefully. Some types of agency, such as media, are more likely to include media billings and other campaign costs in the turnover figure they submit at Companies House. Our roadmap includes the development of benchmarking metrics to overcome this including revenue per head, gross profit and net asset value.
Data for employees / headcount is provided by our partners at The Data City based on reporting to Companies House. As there can be a lag in reporting, The Data City’s machine-learning platform can make an accurate best estimate. If an agency has less than three years reported data on employee number, no estimate is made and no data is reported.
Subsector growth rates
The different agency subsectors are also showing markedly different growth rates. The fastest growing subsectors also include some of the smallest in terms of number of active agencies. These include Amazon/Marketplace (20.4%) and Influencer (16%) agencies. Other subsectors that are showing considerable growth above the sector average include Digital transformation (15.9%), Data and marketing analytics (13.9%) and Brand strategy (11.3%).
Subsector growth rates
About the data
We map the number of agencies in the UK agency sector together with our partners at The Data City, whose sophisticated machine-learning tool allows us to find and categorise active agencies after adjustment for dormant companies and those in liquidation or administration. Depending on the individual agency and the services they offer, agencies can appear in more than one of our subsector lists.
Growth rates are provided by our partners at The Data City and are based on the annual headcount and turnover growth of any given agency we have mapped. Employee count data is more common than turnover data, and to account for the lag in reporting, The Data City’s machine-learning platform can make an accurate best estimate. If an agency has less than three years reported data on employee number, no estimate is made and no growth data is reported.
Our mapping allows us to look into the subsectors and discover the story behind the headline growth rates. We can do this by dividing each subsector into the percentage of agencies that are growing, stable or contracting. The overall sector is mostly stable, with many commentators calling it flat. But as with everything we’re seeing in our mapping, there is nuance and variation.
This is the case when we look at the growth percentages within subsectors. For example, as a whole, and as we have seen, agencies offering Brand strategy services have shown an overall growth of 11.3%. But when viewed using our ‘Growth Traffic Light’, we can see that this is a subsector with one of the highest proportion of shrinking agencies, along with e-Commerce and Translation and localisation.
This is because extremely high growth rates at the top end – and sometimes for only a handful of agencies – can lift the entire subsector growth rate to a place that most of the agencies within it are not experiencing.
Subsectors with the highest proportion of agencies shrinking
About the data
We map the number of agencies in the UK agency sector together with our partners at The Data City, whose sophisticated machine-learning tool allows us to find and categorise active agencies after adjustment for dormant companies and those in liquidation or administration. Depending on the individual agency and the services they offer, agencies can appear in more than one of our subsector lists.
Growth rates are provided by our partners at The Data City and are based on the annual headcount and turnover growth of any given agency we have mapped. Employee count data is more common than turnover data, and to account for the lag in reporting, The Data City’s machine-learning platform can make an accurate best estimate. If an agency has less than three years reported data on employee number, no estimate is made and no growth data is reported.
Our ‘Growth Traffic Light’ breaks down the percentage of agencies in any given group that land in one of five growth rate categories: Shrinking fast (below -20% annual growth), Shrinking (-20% to -10% annual growth), Stable (-10% to 10% annual growth), Growing (10% to 20% annual growth) and Growing Fast (over 20% annual growth). If part of the chart is empty, this means that there were no agencies mapped in that particular interval.
The subsectors with the highest proportion of stable agencies are Copywriting, Design and branding, and Internal communications and employee engagement.
Subsectors with the highest proportion of stable agencies
About the data
We map the number of agencies in the UK agency sector together with our partners at The Data City, whose sophisticated machine-learning tool allows us to find and categorise active agencies after adjustment for dormant companies and those in liquidation or administration. Depending on the individual agency and the services they offer, agencies can appear in more than one of our subsector lists.
Growth rates are provided by our partners at The Data City and are based on the annual headcount and turnover growth of any given agency we have mapped. Employee count data is more common than turnover data, and to account for the lag in reporting, The Data City’s machine-learning platform can make an accurate best estimate. If an agency has less than three years reported data on employee number, no estimate is made and no growth data is reported.
Our ‘Growth Traffic Light’ breaks down the percentage of agencies in any given group that land in one of five growth rate categories: Shrinking fast (below -20% annual growth), Shrinking (-20% to -10% annual growth), Stable (-10% to 10% annual growth), Growing (10% to 20% annual growth) and Growing Fast (over 20% annual growth). If part of the chart is empty, this means that there were no agencies mapped in that particular interval.
The subsectors with the highest proportion of growing agencies are Conversion, Data and marketing analytics, and Influencer.
Subsectors with the highest proportion of agencies growing
About the data
We map the number of agencies in the UK agency sector together with our partners at The Data City, whose sophisticated machine-learning tool allows us to find and categorise active agencies after adjustment for dormant companies and those in liquidation or administration. Depending on the individual agency and the services they offer, agencies can appear in more than one of our subsector lists.
Growth rates are provided by our partners at The Data City and are based on the annual headcount and turnover growth of any given agency we have mapped. Employee count data is more common than turnover data, and to account for the lag in reporting, The Data City’s machine-learning platform can make an accurate best estimate. If an agency has less than three years reported data on employee number, no estimate is made and no growth data is reported.
Our ‘Growth Traffic Light’ breaks down the percentage of agencies in any given group that land in one of five growth rate categories: Shrinking fast (below -20% annual growth), Shrinking (-20% to -10% annual growth), Stable (-10% to 10% annual growth), Growing (10% to 20% annual growth) and Growing Fast (over 20% annual growth). If part of the chart is empty, this means that there were no agencies mapped in that particular interval.
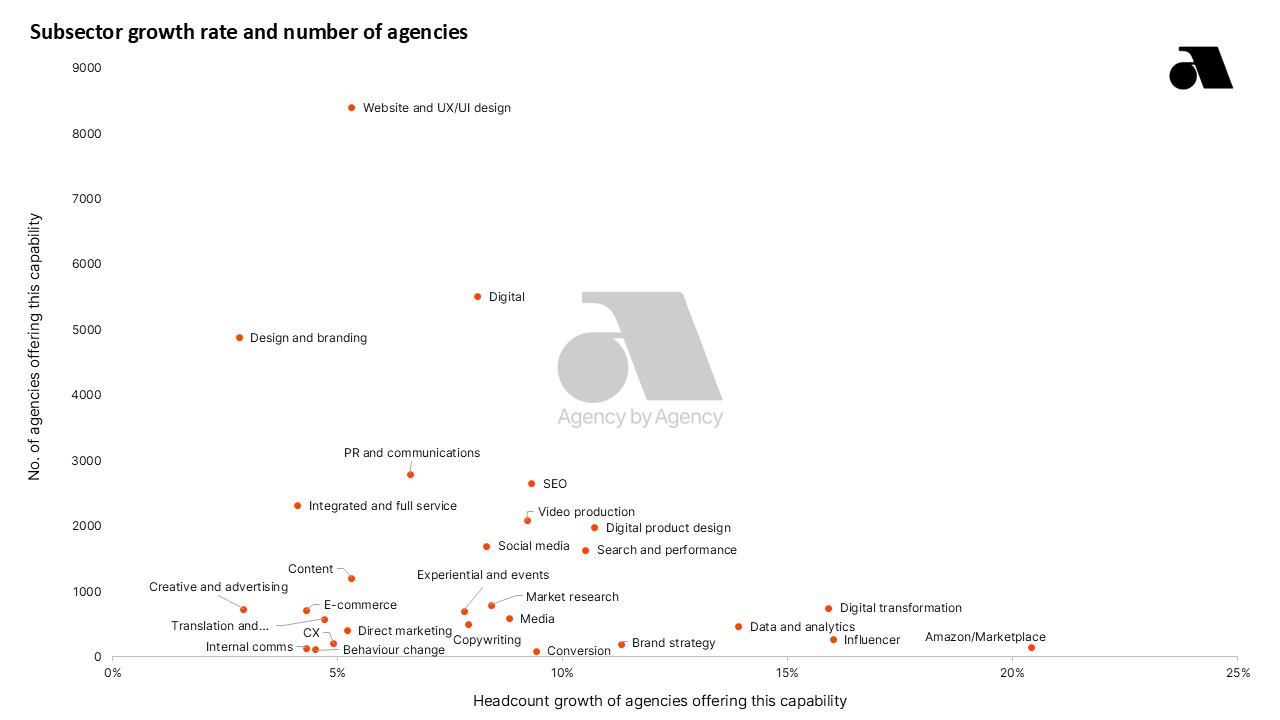
Growth and competitive niches
One of the major benefits from our data is the ability not only to see how many agencies offer a specific service or capability, but also how those agencies are growing. The chart below puts both data points together, plotting each of the 28 subsectors we’ve mapped according to how many agencies there are in the subsector and what the subsector’s growth rate is.
This creates a picture of competitiveness and growth – the bottom right shows the areas of highest growth and least competition, the top left the areas of least growth and highest competition.
Over time, as we add even more niches to our mapping, this picture will get even more sophisticated and will offer agency directors and owners a chance to see opportunities to develop new services or innovate their current offer.
Independents and the Big Seven
Ahead of our Independent Agency Report, to be published in April 2025, our mapping has allowed us to separate independent agencies from those belonging to the “Big Seven” holding companies. We can see that 99% of all agencies are independent.
| Independents | “Big Seven” | |
|---|---|---|
| Number of agencies | 25,320 | 165 |
| Employees | 232,617 | 31,891 |
| Estimated total turnover | £26.7bn | £8.2bn |
| Estimated GVA | £17.7bn | £2.8bn |
About the data
We map the number of agencies in the UK agency sector together with our partners at The Data City, whose sophisticated machine-learning tool allows us to find and categorise active agencies after adjustment for dormant companies and those in liquidation or administration.
We can then divide the list in a number of ways. Based on agency registration at Companies House, we can identify which agencies belong to one of the ‘Big Seven’ – Dentsu Group Inc, Publicis Groupe SA, Stagwell Inc, The Interpublic Group of Companies Inc, Vivendi SA, Omnicom Group Inc, WPP PLC – holding companies, and which can be classified as independent.
“There has been much reporting that the agency landscape and their business models are in decline – well again we are seeing, particularly for independent agencies, that this community is only increasing.
Again the Agency by Agency report supports the Alliance of Independent Agencies own research that 2025 will be a year of growth – and now there is the data that will allow these businesses to effectively benchmark themselves against their peers.”
Clive Mishon / Co Chair & Founder, Alliance of Independent Agencies
Regional distribution and agency clusters
With our first Agency by Agency Industry Report we are focusing on the regional clusters of our sector, based on the UK’s ITL1 regions (International Territorial Level, used by the Office of National Statistics or ONS). In the future we will also focus on city clusters and explore other geographical stories from the data that our mapping brings to light.
The largest single region when it comes to the number of active agencies is London, followed by the South East. In this first report, we are taking a look at the contrast between London and beyond to explore how London-centric the UK agency sector actually is.
Agency locations
About the data
We map the number of agencies in the UK agency sector together with our partners at The Data City, whose sophisticated machine-learning tool allows us to find and categorise active agencies after adjustment for dormant companies and those in liquidation or administration.
For regional distribution of agencies we use the United Kingdom’s ITL1 regions. This stands for International Territorial Level, a geocode standard for subdividing the United Kingdom for statistical purposes and is used by the Office for National Statistics (ONS).
Our partners at The Data City provide us with this data for agencies based on registered company address.
London and outside London comparison
The industry is less concentrated in London than it might sometimes seem. There are 7,691 agencies located in London and 17,681 outside the capital. This of course varies when you look at different sized agencies.
of agencies are in London
of agency employees are in London
of total agency turnover is in London
About the data
We map the number of agencies in the UK agency sector together with our partners at The Data City, whose sophisticated machine-learning tool allows us to find and categorise active agencies after adjustment for dormant companies and those in liquidation or administration.
For regional distribution of agencies we use the United Kingdom’s ITL1 regions. This stands for International Territorial Level, a geocode standard for subdividing the United Kingdom for statistical purposes and is used by the Office for National Statistics (ONS). For this comparison, we are dividing the sector between those agencies who appear in the ITL1 region of London and the rest.
Data for employees / headcount is provided by our partners at The Data City based on reporting to Companies House. As there can be a lag in reporting, The Data City’s machine-learning platform can make an accurate best estimate. If an agency has less than three years reported data on employee number, no estimate is made and no data is reported.
Data for turnover is provided by our partners at The Data City based on financial reporting to Companies House. As there can be a lag in financial reporting, The Data City uses sophisticated modelling to provide estimated turnover for the current year’s values. Where this is impossible, no data is reported.
Our ‘Growth Traffic Light’ shows the percentage breakdown of agencies in London and outside of London based on whether an agency is growing, stable or contracting. Although the number of shrinking agencies is similar both inside and outside of London, there is a greater percentage of agencies showing growth of over 10% in the capital.
Agency growth rates: London and rest of UK
About the data
We map the number of agencies in the UK agency sector together with our partners at The Data City, whose sophisticated machine-learning tool allows us to find and categorise active agencies after adjustment for dormant companies and those in liquidation or administration.
For regional distribution of agencies we use the United Kingdom’s ITL1 regions. This stands for International Territorial Level, a geocode standard for subdividing the United Kingdom for statistical purposes and is used by the Office for National Statistics (ONS). For this comparison, we are dividing the sector between those agencies who appear in the ITL1 region of London and the rest.
Growth rates are provided by our partners at The Data City and are based on the annual headcount and turnover growth of any given agency we have mapped. Employee count data is more common than turnover data, and to account for the lag in reporting, The Data City’s machine-learning platform can make an accurate best estimate. If an agency has less than three years reported data on employee number, no estimate is made and no growth data is reported.
Our ‘Growth Traffic Light’ breaks down the percentage of agencies in any given group that land in one of five growth rate categories: Shrinking fast (below -20% annual growth), Shrinking (-20% to -10% annual growth), Stable (-10% to 10% annual growth), Growing (10% to 20% annual growth) and Growing Fast (over 20% annual growth). If part of the chart is empty, this means that there were no agencies mapped in that particular interval.
When looking at turnover-per-head of agencies of different sizes (based on headcount), we can see that agencies in London report higher turnover-per-head across all size categories, with similar patterns when it comes to the general increase in turnover-per-head as agencies get bigger, with the exception of the largest agencies.
Turnover-per-head by size (headcount)
About the data
We map the number of agencies in the UK agency sector together with our partners at The Data City, whose sophisticated machine-learning tool allows us to find and categorise active agencies after adjustment for dormant companies and those in liquidation or administration.
For regional distribution of agencies we use the United Kingdom’s ITL1 regions. This stands for International Territorial Level, a geocode standard for subdividing the United Kingdom for statistical purposes and is used by the Office for National Statistics (ONS). For this comparison, we are dividing the sector between those agencies who appear in the ITL1 region of London and the rest.
Turnover-per-head is calculated using total turnover and total number of employees. Data for turnover is provided by our partners at The Data City based on financial reporting to Companies House. As there can be a lag in financial reporting, The Data City uses sophisticated modelling to provide estimated turnover for the current year’s values. Where this is impossible, no data is reported.
Naturally, turnover should be treated carefully. Some types of agency, such as media, are more likely to include media billings and other campaign costs in the turnover figure they submit at Companies House. Our roadmap includes the development of benchmarking metrics to overcome this including revenue per head, gross profit and net asset value.
Data for employees / headcount is provided by our partners at The Data City based on reporting to Companies House. As there can be a lag in reporting, The Data City’s machine-learning platform can make an accurate best estimate. If an agency has less than three years reported data on employee number, no estimate is made and no data is reported.
The following charts show the breakdown of the number of agencies active inside and outside of London by size (headcount) and the total number of employees working for agencies of different sizes both inside and outside of the UK capital.
Number of agencies by size (headcount)
About the data
We map the number of agencies in the UK agency sector together with our partners at The Data City, whose sophisticated machine-learning tool allows us to find and categorise active agencies after adjustment for dormant companies and those in liquidation or administration.
For regional distribution of agencies we use the United Kingdom’s ITL1 regions. This stands for International Territorial Level, a geocode standard for subdividing the United Kingdom for statistical purposes and is used by the Office for National Statistics (ONS). For this comparison, we are dividing the sector between those agencies who appear in the ITL1 region of London and the rest.
Data for employees / headcount is provided by our partners at The Data City based on reporting to Companies House. As there can be a lag in reporting, The Data City’s machine-learning platform can make an accurate best estimate. If an agency has less than three years reported data on employee number, no estimate is made and no data is reported.
Agency subsector clusters
By combining data on the geographical distribution of agencies with our subsector mapping and key metrics such as number of agencies and number of employees, it is possible to identify agency clusters based on the types of services agencies offer.
Some of the key variations identified include that under half of agencies offering Media services (44%) are located in London, but they employ more than 83% of all employees employed by Media agencies.
Other agency subsectors are distributed more widely. For example, 77% of the UK’s Website and UX/UI design agencies and 74% of Search and performance agencies are located outside of London, with the South East, North West and Yorkshire and the Humber being particular hotspots.
The subsector with the least amount of clustering in London is Direct marketing, with 80% of agencies offering direct marketing services located outside of the capital. We have identified direct marketing clusters in the South East, North West, North East and in Northern Ireland. Conversion, copywriting and digital agencies are also comparatively less clustered in London, with 76%, 77% and 75% of agencies outside London respectively.
If you are interested in exploring the distribution of agencies in each subsector in more detail, we provide Location data by ITL1 region in each of our 28 Data Shots.
Agencies by region and subsector
About the data
We map the number of agencies in the UK agency sector together with our partners at The Data City, whose sophisticated machine-learning tool allows us to find and categorise active agencies after adjustment for dormant companies and those in liquidation or administration. Depending on the individual agency and the services they offer, agencies can appear in more than one of our subsector lists.
For regional distribution of agencies we use the United Kingdom’s ITL1 regions. This stands for International Territorial Level, a geocode standard for subdividing the United Kingdom for statistical purposes and is used by the Office for National Statistics (ONS).
Our partners at The Data City provide us with this data for agencies based on registered company address.
Distribution of agency employees per region
About the data
We map the number of agencies in the UK agency sector together with our partners at The Data City, whose sophisticated machine-learning tool allows us to find and categorise active agencies after adjustment for dormant companies and those in liquidation or administration. Depending on the individual agency and the services they offer, agencies can appear in more than one of our subsector lists.
Data for employees / headcount is provided by our partners at The Data City based on reporting to Companies House. As there can be a lag in reporting, The Data City’s machine-learning platform can make an accurate best estimate. If an agency has less than three years reported data on employee number, no estimate is made and no data is reported.
For regional distribution of agencies we use the United Kingdom’s ITL1 regions. This stands for International Territorial Level, a geocode standard for subdividing the United Kingdom for statistical purposes and is used by the Office for National Statistics (ONS).
Our partners at The Data City provide us with this data for agencies based on registered company address.
“There is huge strength in the UK’s direct and promotional marketing sector right across the UK. With the latest industry data highlighting specific concentrations of agencies in the South East, North West, North East, and Northern Ireland.
This distribution reflects a broader trend driven by factors such as access to talent, regional investment, and lower operational costs compared to London. While London remains a key hub, the premium on office space and storage—both essential for direct marketing operations—has made regional locations increasingly attractive. As a result, many agencies are establishing themselves in these areas, where they can scale more effectively while maintaining profitability, reinforcing the sector’s continued growth outside the capital.”
Emma Kirk / General Manager, the Institute of Promotional Marketing (IPM)
Women in the agency sector
Our mapping allows us to explore the proportion of agencies that are women-founded (at least one woman director who remains in post after the first year of operation), women-led (majority directors are women) and the total number of active women directors.
of agencies are founded by women
of agencies are led by women
of agencies directors are women
About the data
Gender data for founders, leaders and directors of agencies is provided for us by our partners at The Data City, based on declared titles of officers at Companies House and the UK Government definition of Persons of Significant Control. The Data City does not use machine-learning to estimate gender.
A ‘women-founded agency’ is a company with officers appointed as a director within two years of it being incorporated. An agency can be only founded by women or men, or it can have mixed founders. A ‘women-led agency’ is a company with more active women directors than men directors.
When exploring the number of women directors across the different subsectors we can see some patterns emerging. The five subsectors with the highest proportion of women directors are Copywriting (50.6%), PR & Communications (44.6%), Internal communications (41.4%), Behavioural research and behaviour change (39.5%) and Social media (38%). In contrast, the subsectors with the lowest proportion of women directors are Conversion (19%), Digital product design (20%) and Data and marketing analytics (20.1%).
Percentage of women directors by subsectors
About the data
We map the number of agencies in the UK agency sector together with our partners at The Data City, whose sophisticated machine-learning tool allows us to find and categorise active agencies after adjustment for dormant companies and those in liquidation or administration. Depending on the individual agency and the services they offer, agencies can appear in more than one of our subsector lists.
Gender data for founders, leaders and directors of agencies is provided for us by our partners at The Data City, based on declared titles of officers at Companies House and the UK Government definition of Persons of Significant Control. The Data City does not use machine-learning to estimate gender.
“The numbers of women-led and women-founded agencies, as well as the overall proportion of women directors, are not surprising, but it is great to see an accurate picture for the first time. I am really looking forward to Agency by Agency’s forthcoming gender report to see the detail and variation across different subsectors, agency sizes, and propositions. This is also a valuable opportunity to shine a light on best practice and learn from women-led and founded agencies, helping to drive meaningful change across the industry.”
Becca Doram / Agency Transformation Director, Jnr. Studio
Investment and Innovation Funding
Working with The Data City and their partners at dealroom.co we can see that as a whole, the UK agency sector has attracted total investment funding of £1.5bn. The UK agency sector has also won £36.3m in Innovate UK grant funding.
Investment and agency subsectors
The three subsectors we have mapped that have attracted the highest amount of investment funding are Digital £488m, Social media £368m and Digital product design £366m. Please remember that when we map the agency sector, any given agency can appear in more than one subsector list depending on the services offered.
These subsectors represent a significant percentage of the total investment to the agency sector as a whole.
raised by digital product design agencies
raised by social media agencies
raised by digital agencies
About the data
Our partners at The Data City provide us with data on investment funding via Dealroom.
Innovate UK grant funding and agency subsectors
As part of our Innovate UK and the Agency Sector Report (see below), we are mapping the amount of Innovate UK grant funding that has been awarded across the agency sector as we explore what is currently driving innovation. The three subsectors that we have mapped that have attracted the highest amount of Innovate UK grant funding are Market research £12.3m, Digital product design £6.7m and Digital £4.6m. Please remember that when we map the agency sector, any given agency can appear in more than one subsector list depending on the services offered.
raised by digital agencies
raised by digital product design agencies
raised by market research agencies
About the data
Innovate UK grant funding data includes the total amount of grant funding to agencies we have mapped and the public descriptions of the successful funding bids.
“Agency by Agency’s analysis shines a true light on the innovation, opportunity and diversity across the breadth of the UK’s agency sector for the first time. This is exactly why we’ve built sophisticated mapping and data technologies at The Data City. We’re extremely excited about Agency by Agency’s launch and our joint roadmap to deliver real-time insights for the agency sector”.
Alex Craven, Co-Founder and CEO, The Data City
FAQS
You will find information about all our data points within the report. For an overview of our methodology, the work with our partners at The Data City, and a glossary of definitions for all our data points, please take a look at our FAQs page.
Latest articles and reports
View all
- Article
- Partnership
83p in the pound: Gender pay gaps across the UK’s largest agencies
Exploring the gender pay gap within the UK’s largest agencies and what it means for the sector. In collaboration with gender pay gap consultant Lynda Harvey.
Read more
- Article
- Partnership
The language trap: How agencies describe themselves and what it reveals about differentiation
A collaboration between Agency by Agency and Treacle to explore how similarities in agency descriptions can make it hard to stand out from the crowd.
Read more
- Article
Time to scale-up: How 861 agencies are driving disproportionate sector growth
Just 3.4% of all active agencies qualify as scale-ups, yet they generate a quarter of sector turnover and employ more than a quarter of the workforce. What makes these agencies different?
Read more