
Contents
- What is the gender pay gap?
- Women in the agency sector
- Women-led agencies by size
- Women directors by agency size (headcount)
- Gender pay gap within large agencies
- Mean gender pay gap within agencies mapped
- Median gender pay gap across agencies mapped
- Women in each pay quarter
- Bonuses
- Why does it matter?
- For agency leaders: How does your agency compare?
- About Lynda Harvey
The gender pay gap represents one of the most persistent challenges facing the UK’s creative industries. In collaboration with consultant Lynda Harvey, we have used our mapping of the agency sector to explore agency leadership and the gender pay gap based on the submissions of those agencies large enough to have to do so. And while these agencies only make up 0.3% of all active agencies we have mapped, they employ 20% of the agency workforce.
Understanding gender pay gap in agencies requires not only moving beyond the concept of equal pay as a definition for equity in the sector, but also needs us to look beyond these simple averages to examine the structures that create these disparities. An analysis of these larger agencies reveals not only pay differences, but the underlying distribution of roles and responsibilities that drive them. With women holding 57% of the lowest-paid positions but only 39% of the highest-paid roles, the data tells the start of a story about career progression and opportunity in the sector.
What is the gender pay gap?
It is important that we make clear early on that the gender pay gap is not about equal pay. The British government defines it as “the difference between the average pay of men and women in an organisation”. Depending on where, within any organisation, more women work than men, then a gender pay gap can exist even if a company pays the same salary for the same role.
Companies with over 250 employees in the UK are required to submit a gender pay gap report every year, detailing the mean (average) and median hourly pay gap between men and women in the company, the percentage of men and women in each hourly pay quarter, as well as the percentage of men and women receiving bonus pay and the mean (average) and median pay gap for bonuses.
For example, one UK agency we have mapped who have made a gender pay gap submission to the government, with a headcount in the range of 500 to 999 employees, has 70.1% women and 29.9% men in the lowest pay quarter – meaning that nearly three quarters of the lowest paying jobs in the agency are done by women. At the same time, in the highest pay quarter of the same agency, 37.9% of the jobs are held by women compared to 62.1% by men.
It is unsurprising then, that across this company as a whole, even if there is equal pay for equal roles, women earn 17% less than men in mean (average) salaries, while the median salary for women is 18.2% less than men. In this agency, 43.8% of women have received bonus pay compared to 51.7% of men, while the gender pay gap when it comes to bonuses is a striking 59.2% mean (average) and 50.2% median.
“The biggest misconception I hear when talking to agency leaders is the belief that a gender pay gap can’t exist if you have equal pay policies or transparent pay bands. I also often hear, especially from smaller agencies, that the issue does not apply to them because they do not have two people doing the same job. The reality is that equal pay for equal work is a legal requirement in the UK, so of course most agencies have that in place. But the gender pay gap is about the bigger picture of who is in which roles, who gets promoted, and how opportunities are distributed.
I have seen how easy it is to miss the systemic influences and subtle biases that creep in, even when everyone is trying to do the right thing. Understanding your gender pay gap means taking a step back and looking at the patterns. Are women concentrated in certain teams or levels? Are there invisible barriers to progression?
Although this data represents only a small proportion of agencies, it covers 20% of all agency employees, making it a robust sample. For comparison, the ONS national figures are based on just a 1% sample of employees. Because this report focuses on the largest agencies, the patterns highlighted here may reflect the structures and challenges of bigger organisations. Smaller agencies might see different trends, but the underlying questions about role distribution and progression are just as relevant. That makes it even more important to look closely at what is driving these gaps and to ask what might be happening in your agency, whatever its size.”Lynda, Lynda Harvey Consulting
Women in the agency sector
With submissions only being required of companies with over 250 employees in the UK, and the vast majority of agencies we have mapped being smaller than that, it can be difficult to find comprehensive data on this topic. But based on our mapping of over 25,000 agencies across the country, there are some things that we already know about gender and leadership roles in the agency sector.
Across all active agencies we have mapped, 19.4% are women-led while 30.7% of agency directors are women.
of all UK agencies are women-led
of UK agency directors are women
About the data
Gender data for founders, leaders and directors of agencies is provided for us by our partners at The Data City, based on declared titles of officers at Companies House and the UK Government definition of Persons of Significant Control. The Data City does not use machine-learning to estimate gender.
A ‘women-led agency’ is a company with more active women directors than men directors.
As compulsory submissions for gender pay gap starts with agencies employing over 250 people, it is interesting to establish some context by looking at the leadership of women in agencies across different agency sizes. Here we can see that, while the proportion of women-led agencies remains low, the smaller the agency, the more likely it is to be led by women.
Something similar happens when it comes to the proportion of women directors, with a slight up-tick in the largest (over 250 employees) compared to the size band below.
Women-led agencies by size
Percentage of women-led agencies by size (headcount)
About the data
Gender data for founders, leaders and directors of agencies is provided for us by our partners at The Data City, based on declared titles of officers at Companies House and the UK Government definition of Persons of Significant Control. The Data City does not use machine-learning to estimate gender.
A ‘women-led agency’ is a company with more active women directors than men directors.
Data for employees / headcount is provided by our partners at The Data City based on reporting to Companies House. As there can be a lag in reporting, The Data City’s machine-learning platform can make an accurate best estimate. If an agency has less than three years reported data on employee number, no estimate is made and no data is reported.
Women directors by agency size (headcount)
Percentage of women directors by agency size (headcount)
About the data
Gender data for founders, leaders and directors of agencies is provided for us by our partners at The Data City, based on declared titles of officers at Companies House and the UK Government definition of Persons of Significant Control. The Data City does not use machine-learning to estimate gender.
Data for employees / headcount is provided by our partners at The Data City based on reporting to Companies House. As there can be a lag in reporting, The Data City’s machine-learning platform can make an accurate best estimate. If an agency has less than three years reported data on employee number, no estimate is made and no data is reported.
“It’s not surprising to me that smaller agencies are more likely to be run by women, as many founders I know are drawn to the flexibility that comes with building a business around their own needs and priorities. For some, that means work that fits around family life or other personal commitments.
But with only 19% of agencies being women-led, and no more than a third having a women director, there is still a long way to go. This lack of representation at the top is definitely a big contributing factor towards the sector’s gender pay gap disparity.”
Gender pay gap within large agencies
Of the agencies we have mapped, 74 are large enough to require a gender pay gap submission and have done so for 2025. Although this cannot be seen as an indicator of the gender pay gap across the agency sector as a whole, and while these agencies only account for 0.3% of all active agencies in the UK, they also account for 20% of the agency workforce, which means 1 in 5 agency employees are working within these gender pay gap conditions.
Mean gender pay gap within agencies mapped
Across the 74 agencies, the mean (average) hourly pay for women is 17% lower than men’s, which means that women earn 83p for every £1 that men earn.
Mean (average) pay comparison
About the data
Companies with over 250 employees are required to submit their gender pay gap data via gender pay gap service (Government and Equalities Office, and the Women and Equalities Unit). Our mapping allows us to create a list of agencies based on headcount. Data for employees / headcount is provided by our partners at The Data City based on reporting to Companies House. As there can be a lag in reporting, The Data City’s machine-learning platform can make an accurate best estimate. If an agency has less than three years reported data on employee number, no estimate is made and no data is reported.
With our list of agencies we can then search for the gender pay gap data for each company via the gender pay gap service.
Median gender pay gap across agencies mapped
The mean gender pay gap figure can sometimes be distorted by very high or very low hourly pay at either end of the scale. The gender pay gap data also looks at the median gender pay gap figure for each company. As it is complicated to create an “average” out of a series of median pay gap figures, we show the distribution of agencies across different bands.
Proportion of agencies by median pay gap band
About the data
Companies with over 250 employees are required to submit their gender pay gap data via gender pay gap service (Government and Equalities Office, and the Women and Equalities Unit). Our mapping allows us to create a list of agencies based on headcount. Data for employees / headcount is provided by our partners at The Data City based on reporting to Companies House. As there can be a lag in reporting, The Data City’s machine-learning platform can make an accurate best estimate. If an agency has less than three years reported data on employee number, no estimate is made and no data is reported.
With our list of agencies we can then search for the gender pay gap data for each company via the gender pay gap service.
The national median across all UK employees is 12.8%. As we can see, of the 74 agencies who submitted their data, more than half (56%) have a median pay gap higher than the national median.
Proportion of agencies compared to national median pay gap
About the data
Companies with over 250 employees are required to submit their gender pay gap data via gender pay gap service (Government and Equalities Office, and the Women and Equalities Unit). Our mapping allows us to create a list of agencies based on headcount. Data for employees / headcount is provided by our partners at The Data City based on reporting to Companies House. As there can be a lag in reporting, The Data City’s machine-learning platform can make an accurate best estimate. If an agency has less than three years reported data on employee number, no estimate is made and no data is reported.
With our list of agencies we can then search for the gender pay gap data for each company via the gender pay gap service.
The national median pay gap figure is based on reporting from the Office of National Statistics (2025).
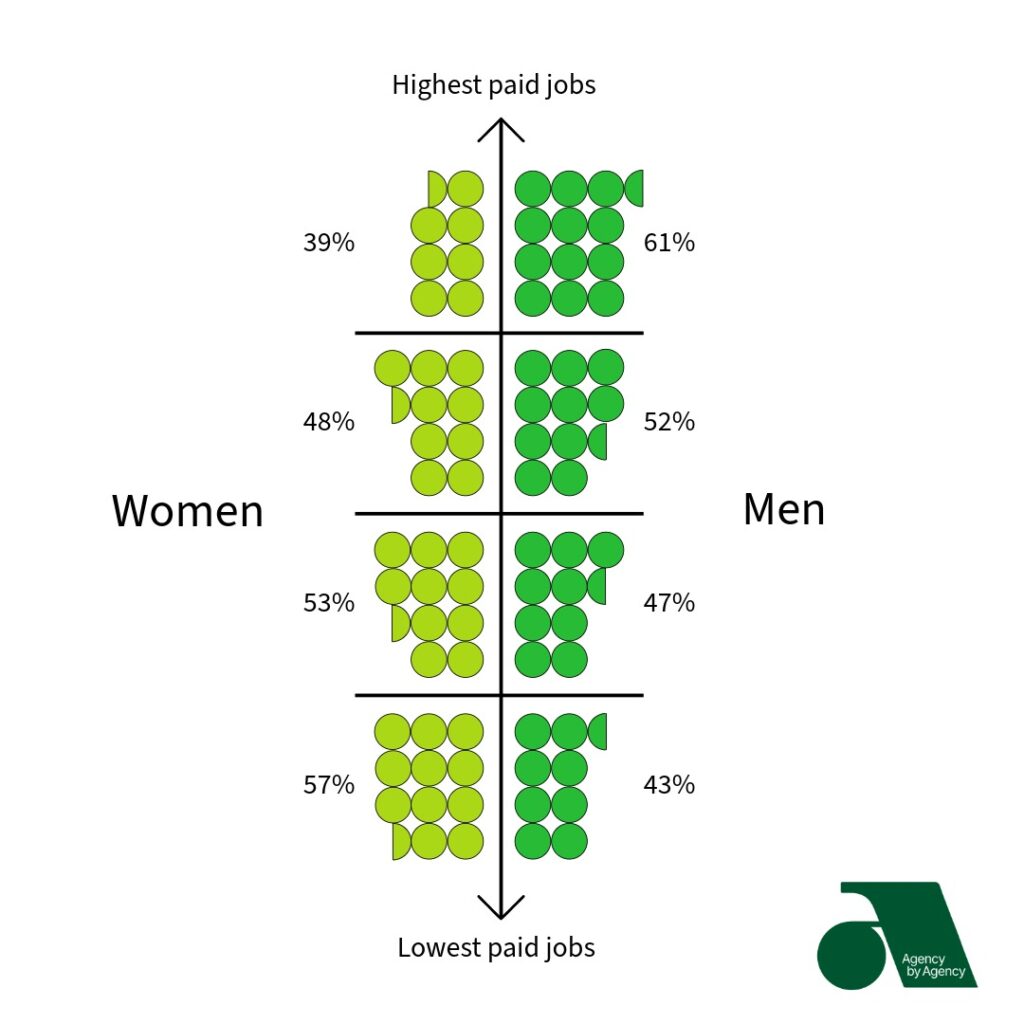
Women in each pay quarter
When we look at the mapped agencies and hourly pay quarters, we can see that women are more likely to hold lower paid jobs in agencies with men having the majority of higher paid positions. In the lowest pay quarter, 57% of roles on average across the agencies mapped are held by women, compared to 43% men. In looking at the averages for the highest paying jobs, 61% of these roles are held by men compared to 39% by women.
These findings alone help explain both the mean (average) and median gender pay gaps within the agencies we have mapped that have made their submissions.
About the data
Companies with over 250 employees are required to submit their gender pay gap data via gender pay gap service (Government and Equalities Office, and the Women and Equalities Unit). Our mapping allows us to create a list of agencies based on headcount. Data for employees / headcount is provided by our partners at The Data City based on reporting to Companies House. As there can be a lag in reporting, The Data City’s machine-learning platform can make an accurate best estimate. If an agency has less than three years reported data on employee number, no estimate is made and no data is reported.
With our list of agencies we can then search for the gender pay gap data for each company via the gender pay gap service.
Bonuses
Across the agencies mapped with gender pay gap submissions, 42% of women received bonuses compared to 44% of men. But the gap is wider when we look not only at who received a bonus, the mean (average) bonus pay. Here we can see that women’s bonus pay was 26% lower than men’s, meaning that women receive 74p in bonuses for every £1 that men receive.
Mean (average) bonus pay comparison
About the data
Companies with over 250 employees are required to submit their gender pay gap data via gender pay gap service (Government and Equalities Office, and the Women and Equalities Unit). Our mapping allows us to create a list of agencies based on headcount. Data for employees / headcount is provided by our partners at The Data City based on reporting to Companies House. As there can be a lag in reporting, The Data City’s machine-learning platform can make an accurate best estimate. If an agency has less than three years reported data on employee number, no estimate is made and no data is reported.
With our list of agencies we can then search for the gender pay gap data for each company via the gender pay gap service.
“When you compare to national averages, the agency sector’s gender pay gap stands out for all the wrong reasons. The mean average gender pay gap across the UK is 14.3% (ONS, 2025), but in this report the agency sector’s mean gap is 17%. To put that into perspective, if a man earns £40,000 a year, a woman is earning £33,200 – a difference of £6,800 every year.
One of the main reasons for this gap is the distribution of roles. Women are underrepresented in higher paid or leadership positions, but they are overrepresented in the lowest paid roles. This is likely to be further exacerbated by a higher proportion of women in part-time roles. Although we don’t have a sector-specific figure, nationally, women account for at least 70% of all part-time employees.
Generally, the median is used for benchmarking purposes, as it’s less affected by a handful of extremely high or low earners, so usually gives a more meaningful perspective. What is striking in this report is that 56% of agencies analysed in this report have a median pay gap higher than the UK average of 12.8%.
Whichever way you look at it, the agency sector is lagging behind the national picture.”
Why does it matter?
Exploring the gender pay gap data from large agencies gives us a starting point to understanding the systemic issues that extend far beyond these individual companies to have an impact across the entire agency community and wider economy. When women earn 83p for every pound men earn in hourly pay, and receive 74p in bonuses for every pound men receive, this represents a substantial loss of earning potential that compounds across entire careers. For the 20% of the agency workforce employed by these larger organisations, these disparities directly impact financial security, career advancement opportunities and long-term wealth accumulation.
The concentration of women in lower-paid roles, representing 57% of the lowest pay quarter compared to just 39% in the highest, suggests barriers to senior leadership that shape not just individual careers but the sector’s access to a range of leadership perspectives. With more than half of the reporting agencies showing median pay gaps above the national average of 12.8%, the agency sector appears to face particular challenges in creating equitable career progression pathways.
All of this matters and for a number of very different reasons. For example, one measure of agency performance and productivity is gross-value-added per head. Our latest mapping of more than 25,000 agencies across the UK shows that the average GVA-per-head in women-led agencies is £91,000 compared to £86,000 for male-led agencies.
Beyond simple economic metrics, the data on leadership and the gender pay gap have broader implications across a sector that is part of one of the key components of the UK’s Industrial Strategy. Any sector that fails to fully make use of the talents and the perspectives of all members of its workforce is risking limiting its creative potential.
“For me, the business case for closing the gender pay gap is impossible to ignore. Yes, it is absolutely the right thing to do, but it is also one of the smartest commercial moves an agency can make.
The evidence in this report is clear. Agencies with women in leadership are not just more representative, they are more productive. The latest mapping shows that women-led agencies generate, on average, £5,000 more GVA-per-head than male-led agencies. This is a direct boost to agency performance.
Wider research backs this up. McKinsey (2023) found that companies with a gender balance of 40% to 60% in leadership roles were more likely to outperform financially, with an even greater uptick when there is a female CEO and/or CFO. It is not about having all-women teams either. The best results come from balance, where different perspectives and experiences are valued and everyone has a seat at the table.
In a sector built on creativity, innovation and client trust, having diverse voices at every level is what keeps ideas fresh and teams resilient.
Closing the gender pay gap is not something that can be achieved overnight, but benchmarking your own data is a straightforward first step. Like any other business KPI, you can’t improve what you don’t measure, and what matters most is showing progress, not perfection. The real value comes from taking the time to look at what is really causing the gap in your agency and to be willing to look for the hidden biases that might be at play. These issues can affect agencies of any size, whether you are five people or five hundred.
Many clients, especially larger brands and public sector organisations, are looking for partners who can evidence progress on gender equality as part of their sustainability or impact reporting. Taking action on gender balance not only strengthens your business, it also helps you meet these growing expectations and demonstrate your impact.”
For agency leaders: How does your agency compare?
Take Lynda’s free agency gender health check to find out how well your agency is doing on gender equity, how you stack up against sector and UK averages, and which areas might need your attention.
Find out where you stand and get practical insights for improvement: www.lyndaharvey.uk/health-check
About Lynda Harvey
Lynda Harvey is passionate about helping agencies close the gender pay gap and build workplaces where women can thrive. With a background in agency leadership and experience as a CIMA management accountant, Lynda combines practical business know-how with real insight into the barriers women face at work. She helps agency leaders make sense of their pay data, uncover the stories behind the numbers, and take positive steps towards fairer, more inclusive teams.
Lynda is a champion for women’s voices in the agency sector and is on a mission to eradicate the agency gender gap. She believes that closing the gap is not just the right thing to do, but also a smart way for agencies to boost profitability, improve efficiency, and strengthen their business for the future. Lynda’s style is open, honest, and shaped by her own experience as a business owner and busy mum. Based in Berkshire, she supports agencies of all sizes across the UK. To find out more about Lynda’s services head to: www.lyndaharvey.uk.
Photo by William Warby on Unsplash
Latest articles and reports
View all
- Article
- Partnership
The language trap: How agencies describe themselves and what it reveals about differentiation
A collaboration between Agency by Agency and Treacle to explore how similarities in agency descriptions can make it hard to stand out from the crowd.
Read more
- Article
Time to scale-up: How 861 agencies are driving disproportionate sector growth
Just 3.4% of all active agencies qualify as scale-ups, yet they generate a quarter of sector turnover and employ more than a quarter of the workforce. What makes these agencies different?
Read more
- Article
Mapping the sector: Agency by Agency’s 2025 story
From creating the first comprehensive mapping of the UK agency sector to launching our Find an Agency service, 2025 has been a journey of discovery, collaboration and impact.
Read more